Example of Survival Analysis
You are investigating the difference in survival times in an experiment where rats were exposed to a carcinogen in two treatment groups. The event in this example is death. The objective is to see whether rats in one treatment group live longer (more days) than rats in the other treatment group.
1. Select Help > Sample Data Folder and open Rats.jmp.
The data in the days column is the survival time. Notice that some observations are censored.
2. Select Analyze > Reliability and Survival > Survival.
3. Select days and click Y, Time to Event.
4. Select Group and click Grouping.
5. Select Censor and click Censor.
6. Click OK.
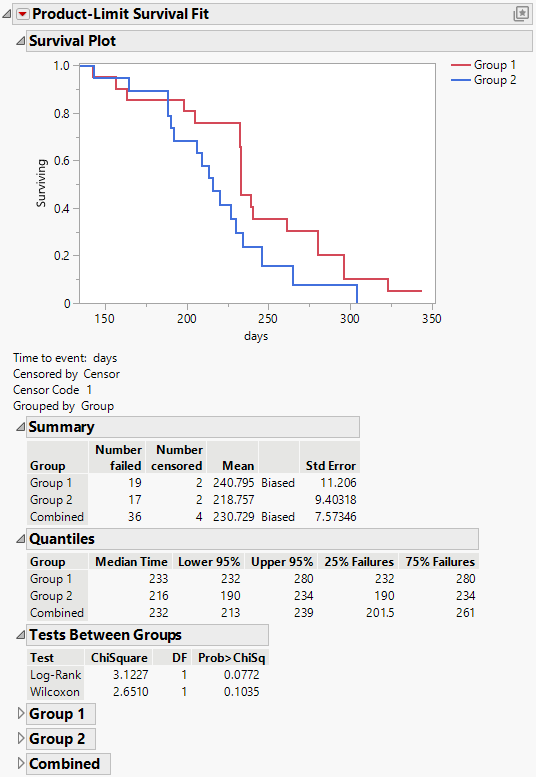
Figure 14.2 Survival Plot for Rats.jmp Data
It appears that the rats in treatment group 1 are living longer than the rats in treatment group 2.
