Example of Using a Knotted Spline Effect
Use the Standard Least Squares personality of the Fit Model platform to fit a model with a knotted spline effect. The Knotted Spline Effect attribute enables you to fit piecewise smooth polynomials to a specified effect. See “Knotted Spline Effect”. This example shows how to test for curvature using a knotted spline effect.
1. Select Help > Sample Data Folder and open Growth.jmp.
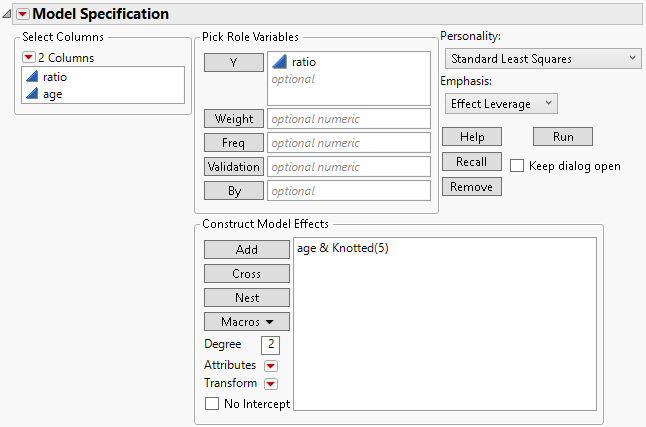
2. Select Analyze > Fit Model.
3. Select the ratio column and click Y.
4. Select the age column and click Add.
5. Select age in the Construct Model Effects list.
6. Select Attibutes > Knotted Spline Effect.
7. In the Knotted Spline Effect window, select Number of Equally Spaced Knots and type 5.
8. Click OK.
Figure 4.59 Fit Model Launch Window
9. Click Run.
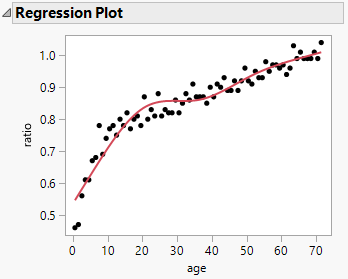
Figure 4.60 Regression Plot with the Spline Fit
The regression plot with a spline fit illustrates the association between age and ratio variables. The plot reveals a nonlinear pattern, which suggests that the relationship between the variables is characterized by curves and bends.

