Process Potential Graph
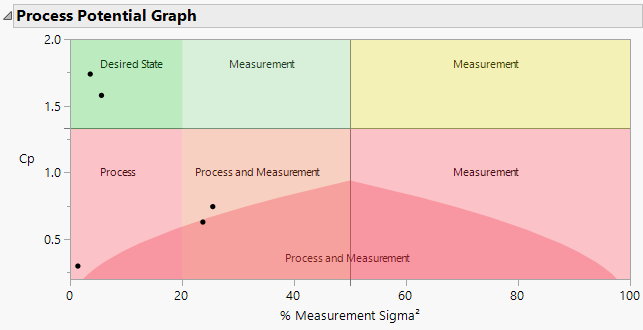
The Process Potential Graph in the Process Screening platform is a plot of Cp versus % Measurement Sigma2 (%MS2). Use this plot to evaluate if the process or the measurement system needs improvement. The graph includes markers for processes that have a Cp value less than 2 and a specified measurement sigma. Hover over points to identify the process. The regions on the plot are colored and labeled to enable the identification of processes or measurements for improvement.
Figure 8.7 Process Potential Graph
The Process Potential Graph contains the following seven regions.
Desired State (Green)
A point in the upper left region of the graph indicates a process that has Cp > 1.33 and %MS2 < 20%. This indicates a process that is in the desired state and there is an adequate measurement system.
Measurement (Green)
A point in the upper middle region of the graph indicates a process that has Cp > 1.33 and %MS2 between 20% and 50%. Consider measurement system improvements in order to increase your chances of detecting process changes.
Measurement (Yellow)
A point in the upper right region of the graph indicates a process that has Cp > 1.33 and %MS2 > 50%. This means that over 50% of the variation is due to the measurement. Consider measurement system improvements.
Process (Red)
A point in the lower left region of the graph indicates a process that has Cp < 1.33 and %MS2 < 20%. This indicates an adequate measurement system, but you should consider process improvements.
Process and Measurement (Orange)
A point in the lower middle region of the graph indicates a process that has Cp < 1.33 and %MS2 between 20% and 50%. Improvements should be considered for both the process and the measurement system.
Measurement (Red)
A point in the lower right region of the graph indicates a process that has Cp < 1.33 and %MS2 > 50%. This means that over 50% of the variation is due to the measurement. Prioritize measurement system improvements.
Process and Measurement (Red)
A point in the lower middle, dark red region on the graph indicates a process that has Cp* < 1.33 and Cp** < 1.33. Consider improvements for both the process and the measurement system.
