Response Roles
The Categorical launch window includes tabs for three groups of response roles (Simple, Related, and Multiple) and a Structured tab where you can create custom data summaries. The response role corresponds to the type of responses you want to analyze. Options on each tab correspond to how the responses are organized in your data table.
Simple Tab
Use the Simple tab to analyze a single response, such as a survey question where only a single answer is allowed. The data to be analyzed is contained in a single column.
Responses
Summarizes data from a single column. If multiple columns are selected, the categorical report contains a separate report for each individual column.
Related Tab
Use the Related tab to analyze a set of related responses across multiple columns.
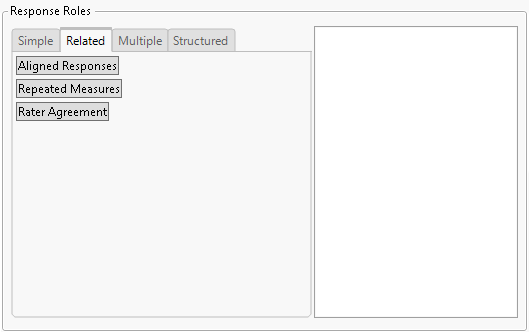
Figure 3.10 Categorical Platform Launch Window Related Tab
Aligned Responses
Summarizes data from multiple columns that have the same response levels in a single report. This option is useful for survey data where you have many questions with the same set of responses. You can quickly summarize and compare response trends for all of the questions at once.
Repeated Measures
Summarizes data from multiple columns where each column contains responses to the same question made at different time points. If an individual responds at multiple time points, the samples are called overlapping. When there are overlapping samples, the Kish correction is used. See Kish (1965, sec. 12.4).
Rater Agreement
Summarizes data from multiple columns where each column is a rating for the same question or item, but is given by a different individual (rater).
Multiple Tab
Use the Multiple tab to analyze multiple responses where the responses are recorded in one or more columns. The options on the Multiple tab are specific to how the data is organized in your data table. A set of multiple responses could be from a survey where the response set allows for more than one choice (check-all-that apply questions), or from a set of defect data where an item can have multiple defects.
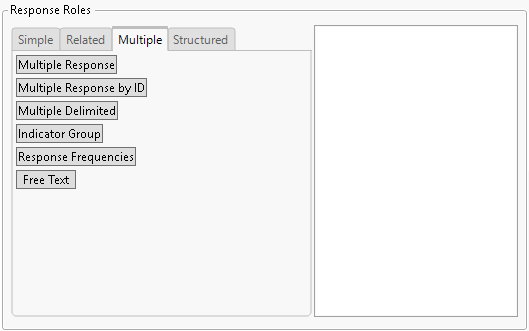
Figure 3.11 Categorical Platform Launch Window Multiple Tab
Multiple Response
Summarizes data from multiple responses where each possible response is recorded in its own individual column. Each column can contain blanks, which correspond to the item not being selected.
Figure 3.12 Multiple Response Column Format
Multiple Response by ID
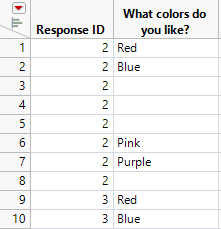
Summarizes data from multiple responses where the data are recorded in a stacked format. There is a single column of responses with a second column containing an ID for the subject.
Figure 3.13 Multiple Response by ID Format
Multiple Delimited
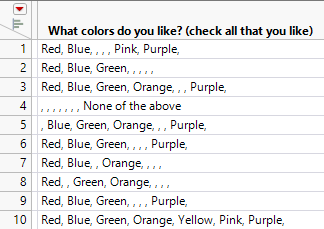
Summarizes data from multiple responses where the responses are in a single column and each response is separated by a comma, semicolon, or tab.
Figure 3.14 Delimited Multiple Response Format
Tip: Use the Multiple Responses column property for columns that contain delineated multiple responses. See “Properties That Control How Columns Are Used in Platforms” in Using JMP.
Indicator Group
Summarizes multiple responses that are stored in indicator columns. The data table contains a column for each possible response, and each column is an indicator (for example, 0 and 1). A blank value indicates a missing response. See Indicator Group.
Response Frequencies
Summarizes multiple responses that are stored in columns that contain frequency counts. This data format is the summarized version of the Indicator Group format. See Response Frequencies.
Free Text
Summarizes text data. The Free Text option launches a Text Explorer report inside the Categorical report window. See “Text Explorer” in Basic Analysis.
Structured Tab
Use the Structured tab to construct custom crosstabulations.
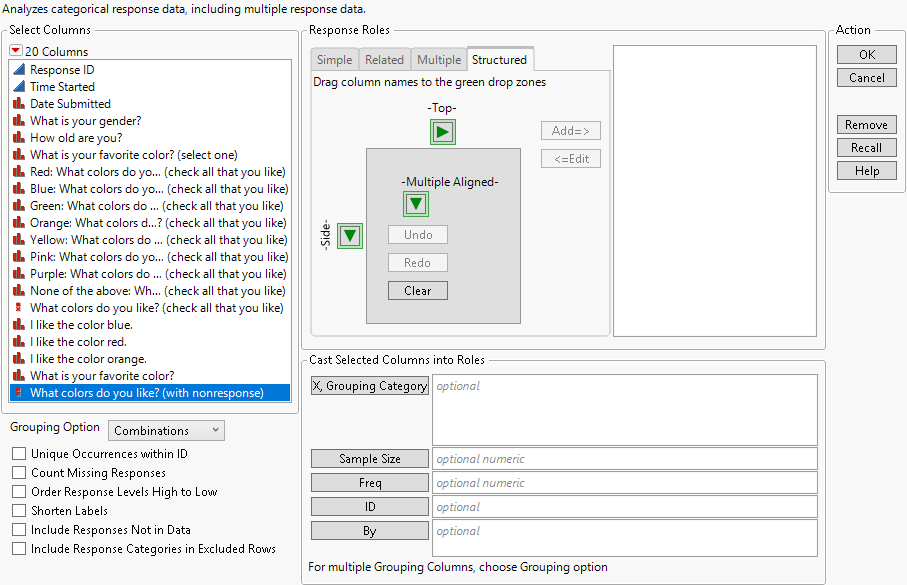
Figure 3.15 Categorical Platform Launch Window for the Structured Tab
The Structured tab has three drop zones for assigning columns to roles. Drag column names to the green drop zone arrows. Alternatively, click the green arrows for a column list to select columns. The resulting structured table considers the innermost terms on the side of the table as responses and all other terms as grouping factors.
Drop Zones
Top
Assigns one or more data table columns to the columns of the crosstabulation table. After one column has been assigned, use the down arrows to nest additional columns within already assigned columns or use the right arrows to add additional column groups.
Side
Assigns one or more data table columns to the rows of the crosstabulation table. After one column has been assigned, use the right arrows to nest additional columns nested within already assigned rows or use the down arrows to add additional row groups.
Multiple Aligned
Assigns two or more columns with aligned response.
Controls
Undo
Click to undo column assignments.
Redo
Click to redo the most recent assignment that was undone.
Clear
Click to remove all assignments in the drop zones.
Add=>
Click to add the constructed table to the structured table list.
<=Edit
Click to make changes to the selected table from the structured table list.
