Show Canonical Details
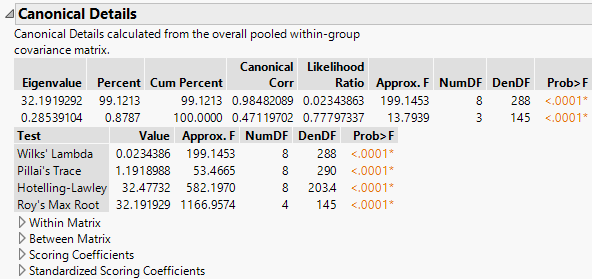
In the Discriminant platform, the Canonical Details report shows tests that address the relationship between the covariates and the grouping variable X. Relevant matrices are presented at the bottom of the report.
Figure 5.11 Canonical Details for Iris.jmp
Note: The matrix used in computing the results in the report is the pooled within-covariance matrix (given as the Within Matrix). This matrix is used as a basis for the Canonical Details report for all discriminant methods. The statistics and tests in the Canonical Details report are the same for all discriminant methods.
Statistics and Tests
The Canonical Details report lists eigenvalues and gives a likelihood ratio test for zero eigenvalues. Four tests are provided for the null hypothesis that the canonical correlations are zero.
Eigenvalue
Eigenvalues of the product of the Between Matrix and the inverse of the Within Matrix. These are listed from largest to smallest. The size of an eigenvalue reflects the amount of variance explained by its associated discriminant function.
Percent
Proportion of the sum of the eigenvalues represented by the given eigenvalue.
Cum Percent
Cumulative sum of the proportions.
Canonical Corr
Canonical correlations between the covariates and the groups defined by the categorical X. Suppose that you define numeric indicator variables to represent the groups defined by X. Then perform a canonical correlation analysis using the covariates as one set of variables and the indicator variables representing the groups in X as the other. The Canonical Corr values are the canonical correlation values that result from this analysis.
Likelihood Ratio
Likelihood ratio statistic for a test of whether the population values of the corresponding canonical correlation and all smaller correlations are zero. The ratio equals the product of the values (1 - Canonical Corr2) for the given and all smaller canonical correlations.
Test
Lists four standard tests for the null hypothesis that the means of the covariates are equal across groups: Wilk’s Lambda, Pillai’s Trace, Hotelling-Lawley, and Roy’s Max Root. See Statistical Details for Multivariate Tests and Statistical Details for Approximate F-Tests.
Approx. F
The F value associated with the corresponding test. For certain tests, the F value is approximate or an upper bound. See Statistical Details for Approximate F-Tests.
NumDF
The numerator degrees of freedom for the corresponding test.
DenDF
The denominator degrees of freedom for the corresponding test.
Prob>F
The p-value for the corresponding test.
Matrices
Four matrices that relate to the canonical structure are presented at the bottom of the report. To view a matrix, click the disclosure icon beside its names. To hide it, click the name of the matrix.
Within Matrix
Pooled within-covariance matrix.
Between Matrix
Between groups covariance matrix, SB. See Statistical Details for the Between Groups Covariance Matrix.
Scoring Coefficients
Coefficients used to compute canonical scores in terms of the raw data. These are the coefficients used for the option Canonical Options > Save Canonical Scores. For more information about how these are computed, see the CANDISC Procedure chapter in SAS Institute Inc. (2023b).
Standardized Scoring Coefficients
Coefficients used to compute canonical scores in terms of the standardized data. Often called canonical weights. For more information about how these are computed, see the CANDISC Procedure chapter in SAS Institute Inc. (2023b).
