Publication date: 06/27/2024
Add Text
In a JMP graph, you can use Text() to draw text at a given location.
Text( <properties>, ( {x, y}|{left, bottom, right, top} ), "text" );
The point and text can be in any order and repeated. You can precede the point and text with an optional first argument: Center Justified, Right Justified, Erased, Boxed, Counterclockwise, or Clockwise. Erased is for removing whatever would otherwise obscure the text in a graph. It paints a background-colored rectangle behind the text.
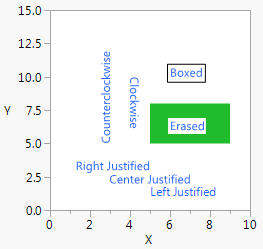
In the following example, notice how the erased text appears inside a white box over the green Rect().
mytext = New Window( "Adding Text",
Graph Box(
Frame Size( 200, 200 ),
Y Scale( 0, 15 ),
X Scale( 0, 10 ),
Text Size( 9 );
Text Color( "blue" );
Text( {5, 1}, "Left Justified" );
Text( Center Justified, {5, 2}, "Center Justified" );
Text( Right Justified, {5, 3}, "Right Justified" );
Fill Color( 4 );
Rect( 5, 8, 9, 5, 1 );
Text( Erased, {6, 6}, "Erased" );
Text( Boxed, {6, 10}, "Boxed" );
Text( Clockwise, {4, 10}, "Clockwise" );
Text( Counterclockwise, {3, 5}, "Counterclockwise" );
)
);
Figure 12.19 Drawing Text in a Graph Box
There is a variant of the Text() function that draws a string inside the rectangle that is specified by four coordinates. Here is the syntax:
Text( {left, top, right, bottom}, string);Want more information? Have questions? Get answers in the JMP User Community (community.jmp.com).
