Additional Example of the Fit Curve Platform
Use the Dissolution Curve Analysis option to determine which factor settings create a tablet that is most similar to a reference tablet in terms of dissolution profiles. There are 16 groups of test tablets, with 6 individual tablets in each group. Each group of test tablets consists of a different combination of four factors. The factor settings for the reference tablet are unknown. First, you compare the dissolution curves of the test tablets to the dissolution curve of the reference tablet. Then, you use the Curve DOE Analysis option to determine appropriate factor settings.
Dissolution Curve Analysis
1. Select Help > Sample Data Folder and open Dissolution DoE.jmp.
2. Select Analyze > Specialized Modeling > Fit Curve.
3. Click the Rows as Functions tab.
4. Select Dissolution60 through Dissolution360 and click Y, Response.
5. Select Batch and click Group.
6. Select Polymer A, Polymer B, Total Polymer, and Compression Force and click Z, Supplementary.
7. Click OK.
8. Click the Fit Curve red triangle and select Dissolution Curve Analysis > Model-Free Comparisons > F2 Analysis.
9. In the Dissolution Curve Specification window, specify R01 as the reference level of Batch.
10. (Optional) In the Dissolution Curve Specification window, type 1234 next to Random Seed.
11. Click OK.
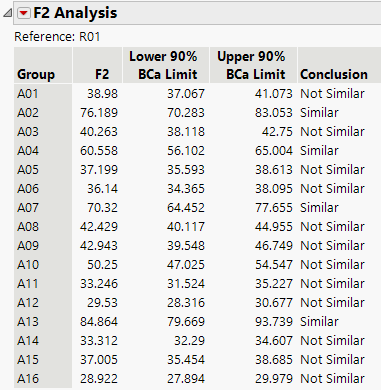
Figure 14.13 F2 Analysis Report
Based on the F2 similarity factor, four of the tablets (A02, A04, A07, and A13) have similar dissolution profiles to the reference tablet. For all of these tablets, the lower 90% confidence limit for F2 is greater than 50. You can select different tabs in the Comparisons section to view the individual comparisons between each test group and the reference group.
Curve DOE Analysis for F2
The F2 Analysis determines which tablets are similar to the reference tablet, but it does not determine why the tablets are similar. The Curve DOE Analysis option performs a Generalized Regression analysis that models F2 as a function of the four supplementary variables that were specified in the launch window.
1. Click the F2 Analysis red triangle and select Curve DOE Analysis.
Since a higher F2 value indicates a more similar tablet to the reference tablet, you can maximize F2 to determine the best factor settings.
2. Click the CDOE Profiler red triangle and select Optimization and Desirability > Desirability Functions.
3. Click the CDOE Profiler red triangle and select Optimization and Desirability > Maximize Desirability.
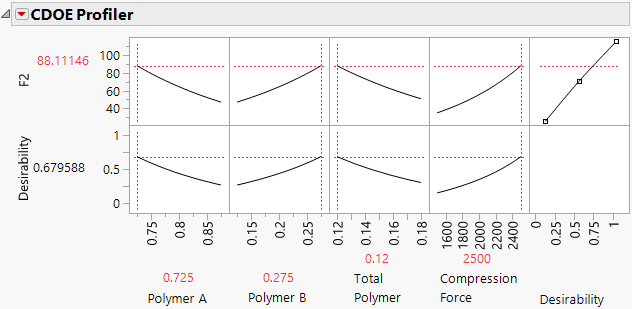
Figure 14.14 Curve DOE Analysis for F2
The following factor settings create a tablet that is most similar to the reference tablet in terms of dissolution profiles:
Polymer A at 0.725
Polymer B at 0.275
Total Polymer at 0.12
Compression Force at 2500

