 Additional Example of the Text Explorer Platform
This example examines aircraft incident reports from the National Transportation Safety Board for events occurring in 2001 in the United States. You want to explore the text that contains a description of the results of the investigation into the cause of each incident. You also want to find themes in the collection of incident reports.
1. Select Help > Sample Data Folder and open Aircraft Incidents.jmp.
2. Select Rows > Color or Mark by Column.
3. Select Fatal from the columns list and click OK.
The rows that contain accidents involving fatalities are colored red.
4. Select Analyze > Text Explorer.
5. Select Narrative Cause from the Select Columns list and click Text Columns.
6. From the Language list, select English.
7. From the Stemming list, select Stem All Terms.
8. From the Tokenizing list, select Basic Words.
9. Click OK.
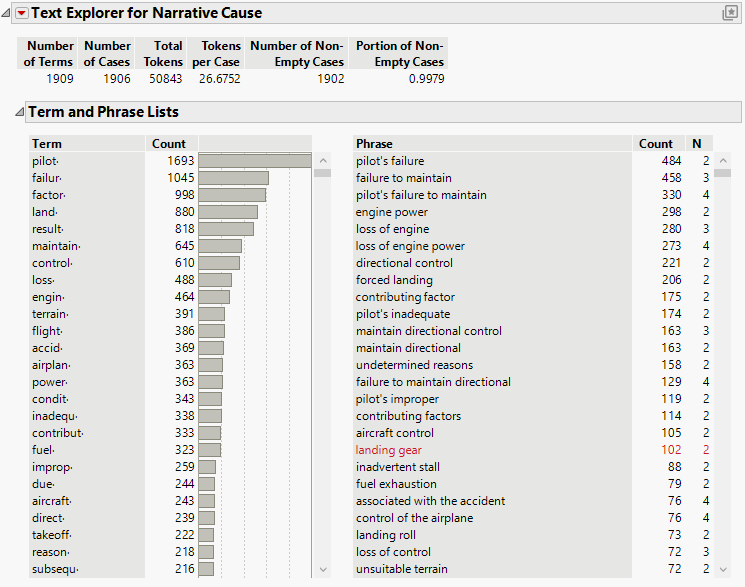
Figure 12.14 Text Explorer Report for Narrative Cause
From the report, you see that there are almost 51,000 tokens and about 1,900 unique terms.
10. Right-click pilot· in the term list and select Select Rows.
From the number of selected rows in the data table, you see that some form of the word “pilot” occurs in more than 1,300 of the incident reports.
11. Right-click pilot· and select Add Stop Word.
Because some form of the word “pilot” occurs frequently compared to other terms, these terms do not provide much information to differentiate among documents. All of the terms that stem to pilot· are added to the stop word list.
 The remaining steps of this example can be completed only in JMP Pro.
12.  Click the red triangle next to Text Explorer for Narrative Cause and select Latent Semantic Analysis, SVD.
This is the first analysis step toward topic analysis, which performs a rotation of the SVD.
13.  In the Specifications window, type 50 for Minimum Term Frequency.
Because there are approximately 51,000 tokens, this frequency is equivalent to a term that represents at least 0.1% of all the terms.
14.  Click OK.
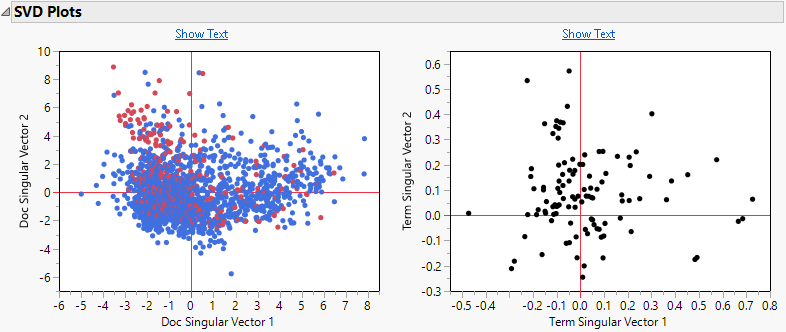
Figure 12.15 SVD Plots for Narrative Cause
There is not a lot of difference in the document SVD plot between fatal and nonfatal incidents.
15.  Click the red triangle next to SVD Centered and Scaled TF IDF and select Topic Analysis, Rotated SVD.
You want to look for groups of terms that form topics.
16.  Type 5 for Number of Topics.
17.  Click OK.
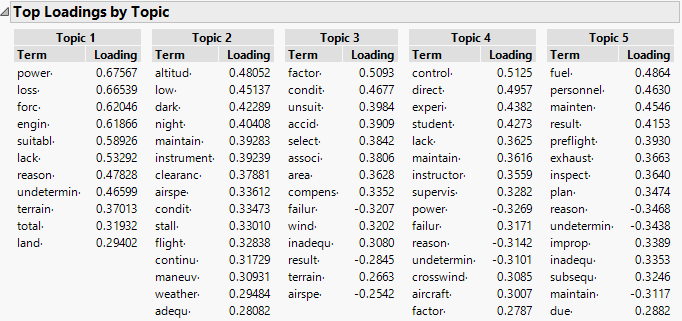
Figure 12.16 Top Loadings by Topics for Narrative Cause
The terms for each topic with the highest loadings enable you to interpret whether the topic is capturing a theme in the incident reports.
For example, Topic 1 has high loadings for power, loss, and engine, indicating a theme of losing power to the engine as a cause of the incident. This corresponds to the phrase “loss of engine power” occurring 273 times in the set of incident reports.
Based on the words with high loadings in Topic 2, it can be described as being related to incidents that involved darkness or low altitude.
18.  Click the gray disclosure icon next to Topic Scores Plots.
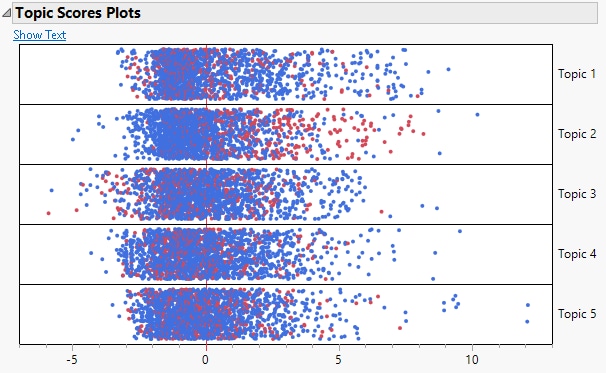
Figure 12.17 Topic Scores Plots for Narrative Cause
Each topic score plot contains a point for each document in the corpus. You can select points in these plots to further examine the text of specific documents.
You want to further explore the subject matter of Topic 2.
19.  Select the three right-most points in the Topic 2 plot and click the Show Text button at the top left of the graph.
The text of the three documents with the highest scores in Topic 2 appear in a new window. From these, you can confirm that Topic 2 relates to low altitude.
At this stage of the text analysis, you have many choices in how to proceed. Text analysis is an iterative process, so you might use topic information to further curate your term list by adding stop words or specifying phrases. You might save the weighted document-term matrix, the vectors from the SVD or rotated SVD as numeric columns in your data table and use them in other JMP analysis platforms. When you use these columns in other platforms, you can also include other columns from your data table in further analyses.


