Analyze Similar Values in the Clustering Platform
Clustering is a multivariate technique that groups observations together that share similar values across a number of variables. Hierarchical clustering combines rows in a hierarchical sequence that is portrayed as a tree. In the cereal example, you see that cereals with certain characteristics, such as high fiber, are grouped in clusters so that you can view similarities among cereals.
Note: For more information about hierarchical clustering, see Hierarchical Cluster in Multivariate Methods.
Scenario
You want to know which cereals are similar to each other and which ones are dissimilar. Analyzing clusters of cereal data reveals answers to the following questions:
• Which cluster of cereals provides little nutritional value?
• Which cluster of cereals is high in vitamins and minerals and contains a low amount of sugar and fat?
• Which cluster of cereals is high in fiber and low in calories?
Create the Hierarchical Cluster Graph
1. With Cereal.jmp displayed, select Analyze > Clustering > Hierarchical Cluster.
2. Select Calories through Enriched, click Y, Columns, and then click OK.
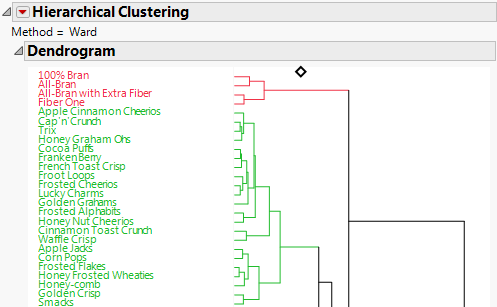
The Hierarchical Clustering report appears. The clusters are colored according to the data table row states.
Figure 6.11 Portion of the Hierarchical Clustering Report
3. Click the Hierarchical Clustering red triangle and select Color Clusters.
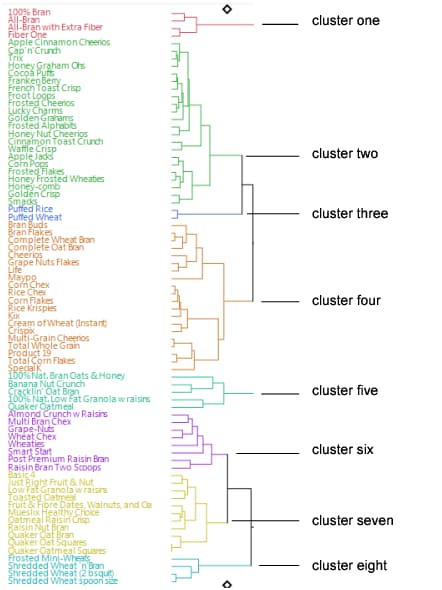
The clusters are colored according to their relationships in the dendrogram.
Figure 6.12 Colored Clusters
The cereals have similar characteristics within each cluster. For example, judging by the names of the cereals in cluster one, you guess that the cereals are high in fiber.
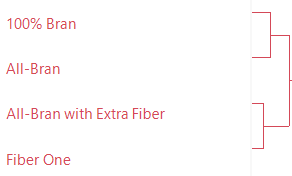
Notice how All-Bran with Extra Fiber and Fiber One are grouped in cluster one. These cereals are more similar to each other than the other two cereals in the cluster.
Figure 6.13 Similar Cereals in Cluster One
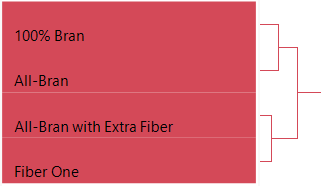
4. To select cluster one, click the red horizontal line on the right.
The four cereals are highlighted in red.
Figure 6.14 Selecting a Cluster
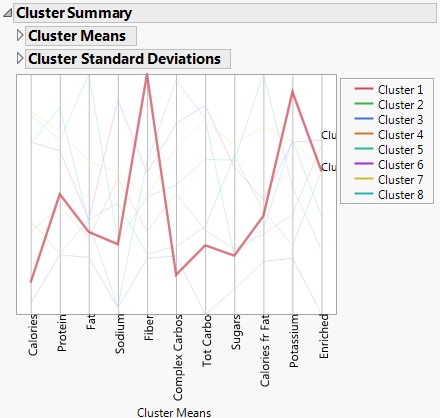
5. To see the similar characteristics in the cluster, click the Hierarchical Clustering red triangle and select Cluster Summary.
The Cluster Summary graph at the bottom of the report shows the mean value of each variable across each cluster. For example, the cereals in this cluster contain more fiber and potassium than cereals in other clusters.
Figure 6.15 Cluster Summary
6. Click the Hierarchical Clustering red triangle and select Scatterplot Matrix.
This option is an alternative to creating a scatterplot matrix in the Multivariate platform.
Note the Fiber plot in the Potassium row. The selected cereals are located on the right side of the plot between 8 and 13 grams. This location indicates that the cereals in cluster one are high in fiber and potassium.
Figure 6.16 Cluster One Characteristics
Note: The points are also selected in the previous scatterplot matrix that you created if it is still open.
Interpret the Results
Clicking through the clusters and looking at the Cluster Summary report, you can see the following characteristics:
• Cluster one cereals, such as Fiber One and All-Bran, contain high fiber and potassium and low calories.
• Cluster two cereals, which contain many favorite children’s cereals, are high in sugar and low in fiber, complex carbohydrates, and protein.
• Cluster three cereals (Puffed Rice and Puffed Wheat) are low in calories but provide little nutritional value.
• Cluster four cereals, such as Total Corn Flakes and Multi-Grain Cheerios, provide 100% of your daily requirement of vitamins and minerals. They are low in fat, fiber, and sugar.
• Cluster five cereals are high in protein and fat and low in sodium. The cluster consists of cereals such as Banana Nut Crunch and Quaker Oatmeal.
• Cluster six cereals are low in fat and high in sodium and carbohydrates. Traditional cereals such as Wheaties and Grape-Nuts are in this cluster.
• Cluster seven cereals are high in calories and low in fiber. Many cereals that include dried fruit are in this cluster (Mueslix Healthy Choice, Low Fat Granola w Raisins, Oatmeal Raisin Crisp, Raisin Nut Bran, and Just Right Fruit & Nut).
• Cluster eight cereals are low in sodium and sugar, and high in complex carbohydrates, protein, and potassium. Shredded Wheat and Mini-Wheat cereals are in this cluster.
By looking at the joins in the dendrogram, you can see which cereals in each cluster are most similar.
• In cluster one, Fiber One is similar in nutritional value to All-Bran with Extra Fiber. 100% Bran and All-Bran are also similar. Each pair of similar cereals are made by different companies, so the cereals are competing against each other.
• In cluster two, Frosted Flakes and Honey Frosted Wheaties are similar even though one is a corn flake and the other is a wheat flake. Lucky Charms and Frosted Cheerios are similar. Cap’n’Crunch and Trix are also similar.
Draw Conclusions
Based on your desire to eat more fiber and fewer calories, you decide to try the cereals in cluster one. You will avoid cereals in cluster three, which consists of puffed wheat and puffed rice and have little nutritional value. And you will try cereals in the highly nutritious cluster four.
