Data and Fitted Models
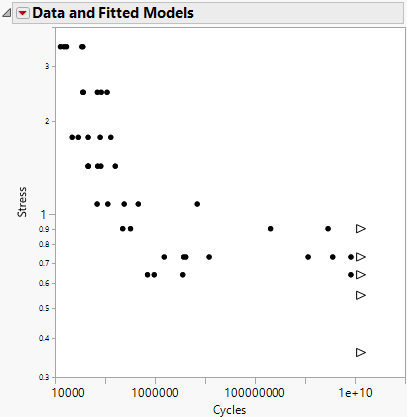
The Data and Fitted Models section of the Fatigue Model report contains a scatterplot of the logarithm of the strain or stress variable (S) versus the logarithm of the lifetime variable (N). Following the convention of plotting S-N data, the scatterplot appears on a log-log scale by default. The initial scatterplot contains only the data points, but models are added to this scatterplot as they are fit. Censored observations are denoted with triangles.
Figure 6.5 Initial Data and Fitted Models Report
Data and Fitted Models Report Options
The Data and Fitted Models red triangle menu contains the following options:
Hide to Deemphasize
(Appears only when more than one model has been fit.) Hides or dims all non-selected models in the plot when at least one model is selected. You can select a model by clicking it in the plot, selecting it in the legend to the right of the plot, or selecting it in the Model Comparisons section of the report.
Show Legend
Shows or hides a legend of the fitted models. The legend appears to the right of the plot.
Transposed Axes
Switches the axes of the plot. When this option is selected, the plot shows the logarithm of the lifetime variable (N) versus the logarithm of the strain or stress variable (S).
Configure Fitted S-N Style
Enables you to change the appearance of the fitted models in the plot. The following options are available:
Show Primary Quantile Curve
Shows or hides the default fitted model curves.
Probability of the Quantile
Specifies the quantile at which the default fitted model curve is plotted.
Show Confidence Interval
Shows or hides a shaded confidence interval around the fitted model curve.
Confidence Level
Specifies the confidence level for the confidence interval. For example, a confidence level of 0.95 affects the width of a two-sided confidence interval. Each endpoint of the confidence interval then provides a one-sided (lower or upper) confidence bound with a confidence level of 0.975.
Show Additional Quantile Curves
Shows or hides fitted model curves at one or more other quantile values.
Configure Fatigue Life Densities
Enables you to add density curves to the plot at specified levels of the strain or stress variable (S). In the default orientation of the plot, these curves appear on a horizontal axis.
Configure Fatigue Strength Densities
Enables you to add density curves to the plot at specified levels of the lifetime variable (N). In the default orientation of the plot, these curves appear on a vertical axis.
