Publication date: 06/27/2024
Draw Pies and Arcs
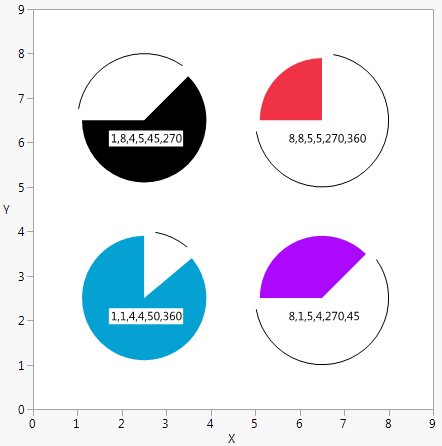
Pie() and Arc() draw wedges and arc segments in JMP graphs. The first four arguments are x1, y1, x2, and y2, the coordinates of the rectangle to inscribe. The last two arguments are the starting and ending angle in degrees, where 0 degrees is 12 o'clock and the arc or slice is drawn clockwise from start to finish.
win = New Window( "Pies and Arcs",
Graph Box(
Frame Size( 400, 400 ),
X Scale( 0, 9 ),
Y Scale( 0, 9 ),
Fill Color( "Black" ), // top left
Pie( 1.1, 7.9, 3.9, 5.1, 45, 270 ),
Text( Erased, {1.75, 6}, "1,8,4,5,45,270" ),
Arc( 1, 8, 4, 5, 280, 35 ),
Fill Color( "Red" ), // top right
Pie( 7.9, 7.9, 5.1, 5.1, 270, 360 ),
Text( Erased, {5.75, 6}, "8,8,5,5,270,360" ),
Arc( 8, 8, 5, 5, 370, 260 ),
Fill Color( "BlueCyan" ), // bottom left
Pie( 1.1, 1.1, 3.9, 3.9, 50, 360 ),
Text( Erased, {1.75, 2}, "1,1,4,4,50,360" ),
Arc( 1, 1, 4, 4, 370, 40 ),
Fill Color( "Purple" ), // bottom right
Pie( 7.9, 1.1, 5.1, 3.9, 270, 45 ),
Text( Erased, {5.75, 2}, "8,1,5,4,270,45" ),
Arc( 8, 1, 5, 4, 55, 260 )
)
);
Figure 12.14 Drawing Pies and Arcs
Want more information? Have questions? Get answers in the JMP User Community (community.jmp.com).
