EMP Results Report
In the Measurement Systems Analysis platform, the EMP Results report computes several statistics to help you assess and classify your measurement system. Using this report, you can determine the following:
• How your process chart is affected.
• Which tests to set.
• How much the process signal is attenuated.
• How much the bias factors are affecting your system and reducing your potential intraclass correlation coefficient.
Note: The statistics in this report are based on ranges in the following instances: if you selected EMP as the MSA Method and Range as the Chart Dispersion Type, and you have a one factor or a two factor, balanced, crossed model. Otherwise, the statistics in this report are based on variances.
The EMP Results report contains the following calculations:
Test-Retest Error
Indicates measurement variation or repeatability (also known as within error or pure error).
Degrees of Freedom
Indicates the amount of information used to estimate the within error. See Statistical Details for Degrees of Freedom Calculation.
Probable Error
The median error for a single measurement. Indicates the resolution quality of your measurement and helps you decide how many digits to use when recording measurements. See Shift Detection Profiler.
Intraclass Correlation
Indicates the proportion of the total variation that you can attribute to the part. If you have very little measurement variation, this number is closer to 1.
Intraclass Correlation (no bias)
Does not take bias or interaction factors into account when calculating the results.
Intraclass Correlation (with bias)
Takes the bias factors (such as operator, instrument, and so on) into account when calculating the results.
Intraclass Correlation (with bias and interaction)
Takes the bias and interaction factors into account when calculating the results. This calculation appears only if the model is crossed and uses standard deviation instead of range.
Bias Impact
The amount by which the bias factors reduce the Intraclass Correlation.
Bias and Interaction Impact
The amount by which the bias and interaction factors reduce the Intraclass Correlation. This calculation appears only if the model is crossed and uses standard deviation instead of range.
Monitor Classification Legend
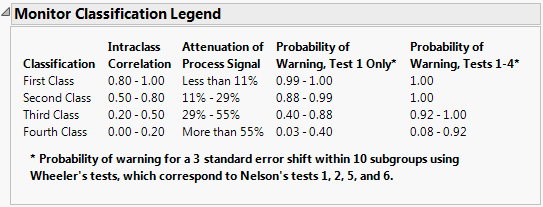
The EMP Results report contains a Monitor Classification Legend, which describes the system and classification parameters in the Measurement Systems Analysis platform.
Figure 4.6 Monitor Classification Legend
This legend describes the following classifications: First, Second, Third, and Fourth Class. Each classification indicates the following:
• the corresponding Intraclass Correlation values
• the amount of process signal attenuation (decrease)
• the chance of detecting a 3 standard error shift within 10 subgroups, using Wheeler’s test one or all four tests
Wheeler (2006) identifies four detection tests known as the Western Electric Zone Tests. Within the Shift Detection Profiler, there are eight tests that you can select from. The tests that correspond to the Wheeler tests are the first, second, fifth, and sixth tests.
Tip: To prevent the legend from appearing, deselect Show Monitor Classification Legend in the EMP Measurement Systems Analysis platform preferences.
