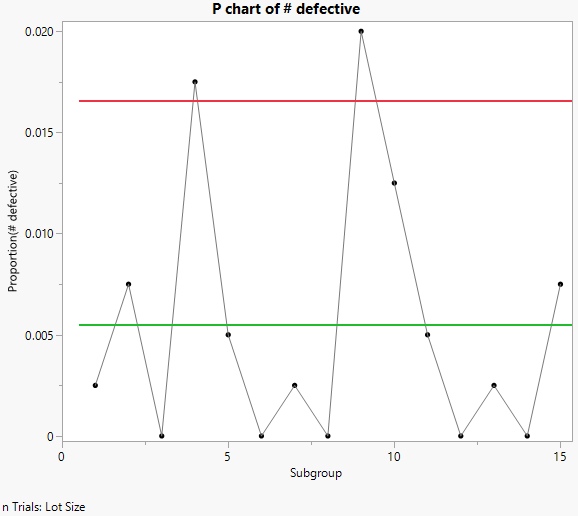
Example of a P Chart
In this example, you use the P Control Chart launch window to launch Control Chart Builder. You want to create a P chart to analyze defect data on galvanized washers for two different lot sizes. The washers were inspected for finish defects such as rough galvanization and exposed steel. If a washer contained a finish defect, it was deemed nonconforming or defective. Thus, the defect count represents how many washers were defective for each lot of size 400.
1. Select Help > Sample Data Folder and open Quality Control/Washers.jmp.
2. Select Analyze > Quality and Process > Control Chart > P Control Chart.
3. Select # defective and click Y, n Defective.
4. Select Lot Size and click n Trials.
5. Click OK.
6. Right-click the graph and select Limits > Show Lower Limit to deselect the Show Lower Limit option.
This hides the lower limit, which is not of interest in this situation.
Figure 3.26 P chart of # defective with sample size
To view the differences between constant and variable sample sizes, you can compare charts for Lot Size and Lot Size 2 by simply dragging the variables to the nTrials zone.
