Example of a Supersaturated Design Analysis
Use the Fit Two Level Screening platform to analyze a supersaturated design. A supersaturated design has more factors than runs. They rely heavily on effect sparsity for their analysis, so the Fit Two Level Screening platform is ideal for their analysis. The objective is to determine which effects are active.
In this example, a simulated design with 18 factors but only 12 runs is considered. Y is generated by this:

where ε ~ N(0,1). So, Y has been constructed with three active factors.
1. Select Help > Sample Data Folder and open Supersaturated.jmp.
2. Select DOE > Classical > Factor Screening > Fit Two Level Screening.
3. Select Y and click Y.
4. Select X1 through X18 and click X.
5. Click OK.
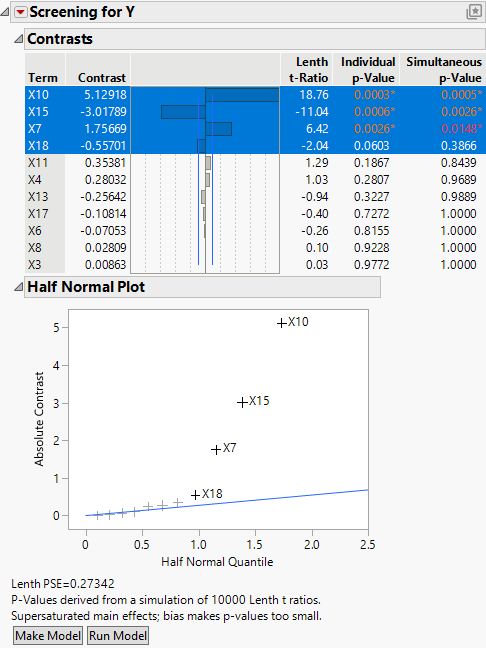
Figure 11.9 Screening Report for Supersaturated.jmp
Note: Since the p-values are obtained using a simulation-based technique, your p-values might not precisely match those shown here.
Note that four factors have been highlighted. Factors X10, X15, and X7 are active based on a 0.05 critical value criteria. In the Half Normal Plot, X18 is close to the blue line, which indicates that it is close to the 0.1 cutoff value for significance. The 0.1 critical value is generous in its selection of factors so that you do not miss those that are possibly active.
The contrast estimates for X10, X15, and X7 of 5.1, –3, and 1.8 are close to their simulated values (5, –3, 2).
The p-values are not entirely valid statistically, since they are based on a simulation that assumes orthogonal designs, which is not the case for supersaturated designs. However, as shown, they can be useful in identifying effects for further investigation.
