Publication date: 06/27/2024
Example of a Surface Plot for a Single Mathematical Function
You can use the Surface Plot to produce the graph of a mathematical function without any data points.
1. Select Graph > Surface Plot.
Note: This can be done with or without a data table open.
2. Click OK.
When you click OK in the Surface Plot launch window without selecting any columns, the default surface plot report appears. If no data tables are open, the launch window does not appear and this step can be skipped.
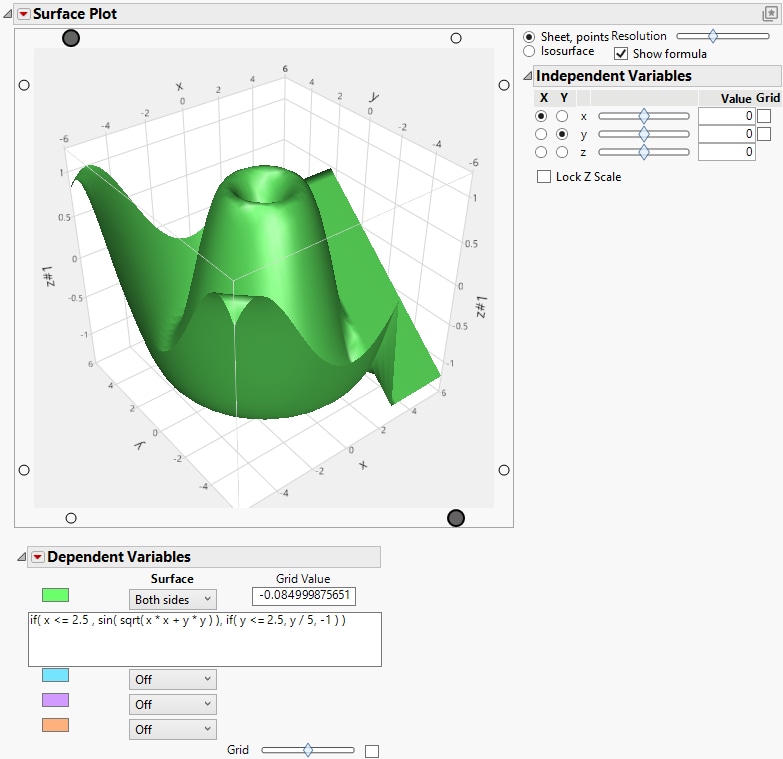
3. In the Appearance Controls, select the Show Formula check box to show the formula space.
Figure 5.13 Default Surface Plot with Formula
The default function shows in the box. To plot your own function, enter it in this box.
Want more information? Have questions? Get answers in the JMP User Community (community.jmp.com).
