Example of Fitting a Fixed Parameter Competing Cause Model
This example illustrates how to include the Fixed Parameter model into the aggregated distribution:
1. Select Help > Sample Data Folder and open Reliability/Appliance.jmp.
2. Select Analyze > Reliability and Survival > Life Distribution.
3. Select Time Cycles and click Y, Time to Event.
4. Select Cause Code and click Failure Cause.
5. Select Allow failure mode to use fixed parameter models.
6. Click OK.
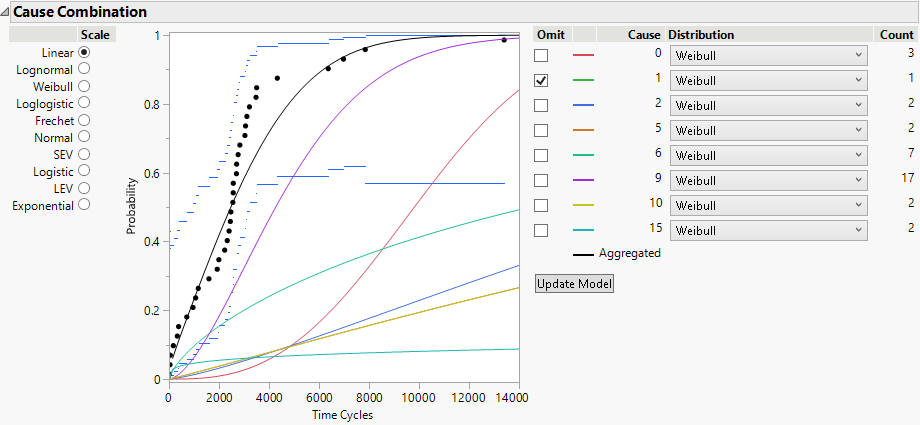
Figure 3.25 Fixed Parameter Model with Cause 1 Omitted
By default, Cause = 1 is omitted, because there are not enough data. However, you do not want this cause to be omitted.
7. Open the Individual Causes report for Cause 1. The report is called Life Distribution - Failure Cause: 1 Failure Counts: 1.
8. Click the red triangle next to Parametric Estimate - Weibull and select Fix Parameter.
9. Select Weibull beta and type 2.
10. Click Update.
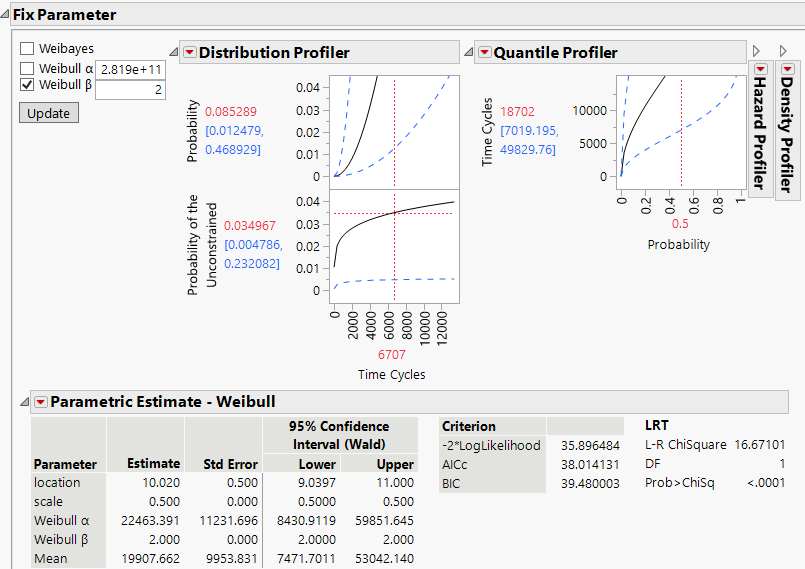
Figure 3.26 Fixed Parameter Model with Weibull Beta Specified
In the Parametric Estimate - Weibull report, assuming β equals 2, the alpha parameter is estimated to be 22463.391. Now you can use this for the failure distribution for Cause=1.
11. Scroll up to Cause Combination at the top of the report window.
12. Deselect Omit for Cause 1.
13. For the distribution for Cause 1, select Fixed Parameter Weibull.
14. Click Update Model.
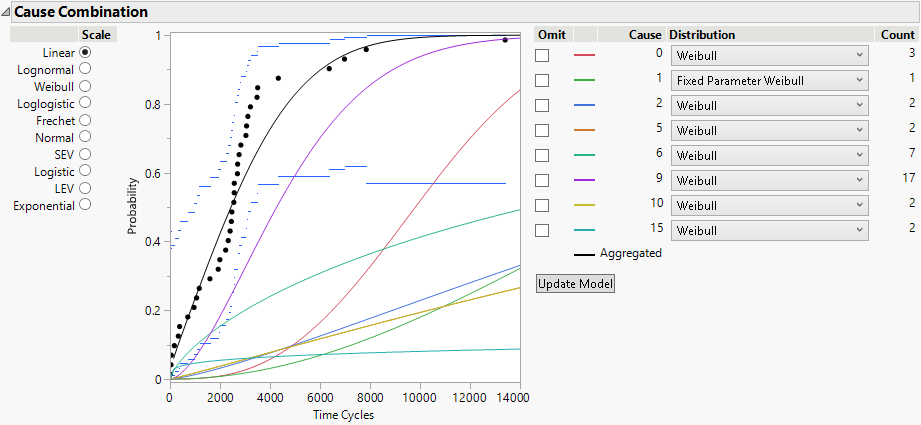
Figure 3.27 Updated Model Showing Cause 1
Now the aggregated model uses the Fixed Parameter Weibull results for Cause 1 in the overall competing cause model.


