Example of Platform Presets
This example uses a Platform Preset to quickly check if a continuous variable is normally distributed. Many sample Platform Presets are available to accomplish common tasks like this.
The data consists of important parameters, suppliers, measurements, and quality indicators related to the tablet production process. The goal is to check the normality of the Dissolution rate of the tablet.
This example does the following:
• Opens a data table
• Runs an analysis on that table, producing a report
• Applies a sample Platform Preset to that report to add details and modify formatting
Begin by selecting Help > Sample Data Folder and open Tablet Production.jmp.
1. Select Analyze > Distribution.
2. Select Disso and click Y, Columns.
3. Click OK.
4. Click the Platform Preset button ![]() in the Disso menu bar.
in the Disso menu bar.
5. Select Sample Presets > Check Normality.
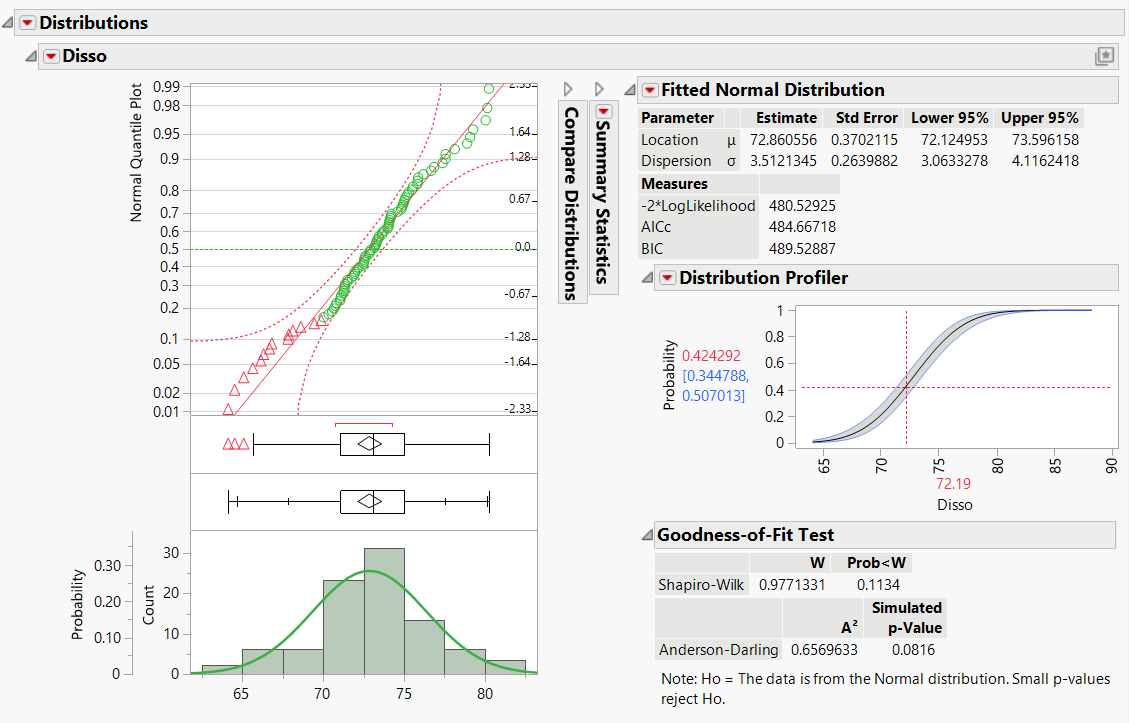
Figure 10.2 The Distribution report updated by a sample Platform Preset.
The sample Platform Preset minimizes the Summary Statistics and adds the following to the report window: a Normal Quantile Plot of the Disso variable, the Fitted Normal Distribution report, a Distribution Profiler, and a Goodness-of-Fit Test.
Because the normal quantile plot approximates a straight diagonal line, the Disso variable appears to be normally distributed.
