Example of Simple Linear Regression
Use the Standard Least Squares personality of the Fit Model platform to fit a linear regression model. You are interested in the relationship between population and ozone level for a set of cities.
1. Select Help > Sample Data Folder and open Polycity.jmp.
2. Select Analyze > Fit Model.
3. Select OZONE and click Y.
4. Select POP and click Add.
5. (Optional) From the Emphasis list, select Minimal Report.
Note: You can use the Emphasis option to obtain a minimal report for this platform.
6. Click Run.
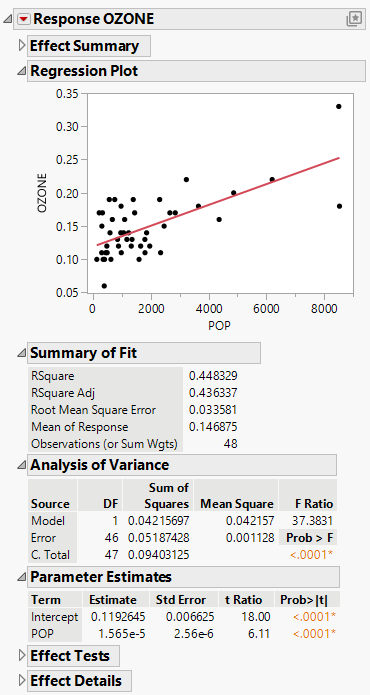
Figure 4.1 Fit Least Squares Report
The Fit Least Squares report provides information about the fitted model that can be used to assess the quality of the model fit and evaluate the significance of predictors. The regression plot shows the data points and a simple linear regression model fit to the data. The plot shows that OZONE trends up with POP.
The report also includes tables such as Summary of Fit, Analysis of Variance, and Parameter Estimates. These tables can be used to assess the significance of the predictors and the overall fit of the model. They can also be used to estimate the direction and magnitude of the relationship between the predictor variable and the response variable.
