Publication date: 06/27/2024
Example of Subcategories
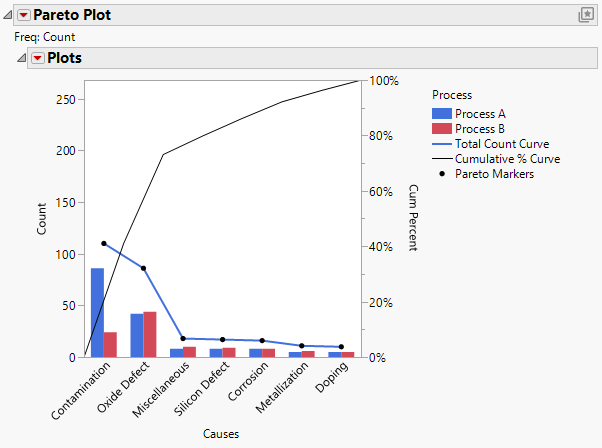
This example uses a Pareto plot to compare the causes of failure during the fabrication of integrated circuits for two different processes. To see both processes on the same plot, a subcategory is defined.
1. Select Help > Sample Data Folder and open Quality Control/Failures.jmp.
2. Select Analyze > Quality and Process > Pareto Plot.
3. Select Causes and click Y, Cause.
4. Select Process and click Subcategory.
5. Select Count and click Freq.
6. Click OK.
Figure 15.16 Pareto Plot with Subcategories
The number of failures for each process and cause combination appears on the same Pareto plot. To change the bar style of the subcategories, click the Plots red triangle and select Pareto > Subcategory Bar Style.
Want more information? Have questions? Get answers in the JMP User Community (community.jmp.com).
