Publication date: 06/27/2024
Example of the Mixture Profiler
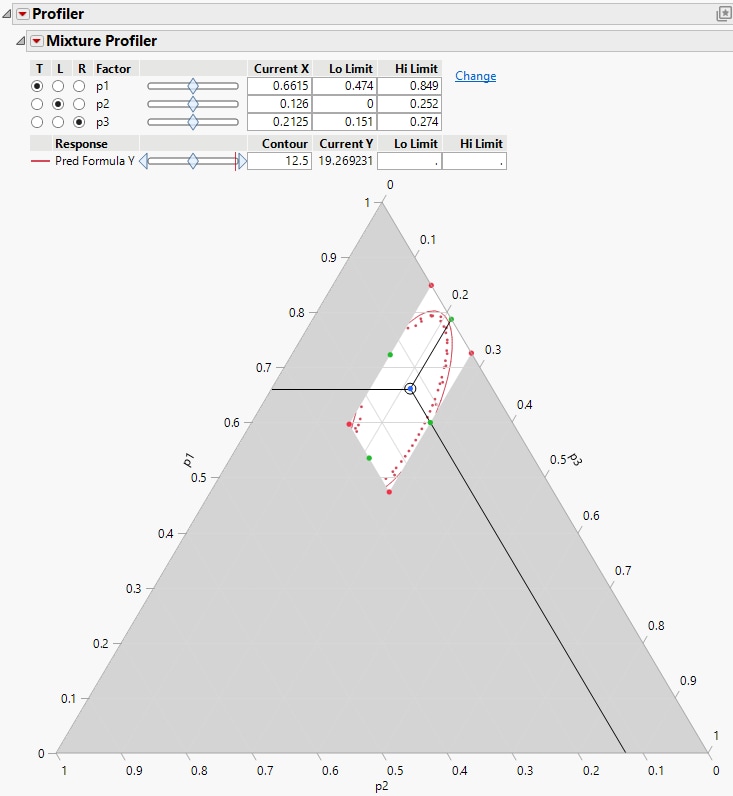
This example explores how the feasible region of a response is impacted by three mixture components. There are constraints on the levels of the mixture components. Use the saved prediction formula column for the response that is in the data table.
1. Select Help > Sample Data Folder and open Plasticizer.jmp.
2. Select Graph > Mixture Profiler.
3. Select Pred Formula Y and click Y, Prediction Formula.
4. Click OK.
Figure 6.4 Example of Mixture Profiler
Use the factor sliders to explore how changes impact the response. The unshaded region is the feasible region for this data set.
Want more information? Have questions? Get answers in the JMP User Community (community.jmp.com).
