Example of Tukey HSD All Pairwise Comparisons
Use the Standard Least Squares personality of the Fit Model platform to fit a linear regression model and use Tukey HSD pairwise comparison test to investigate the effect of a predictor on the response while controlling for additional factors.
In this example, you are interested in Cholesterol differences for gender and non-smokers versus former smokers (Smoking History equal to no and quit, respectively) across two ages (25 and 35) and average height.
1. Select Help > Sample Data Folder and open Lipid Data.jmp.
2. Select Analyze > Fit Model.
3. Select Cholesterol and click Y.
4. Select Gender, Age, Height, and Smoking History, and click Add.
5. Click Run.
6. Click the red triangle next to Response Cholesterol and select Multiple Comparisons.
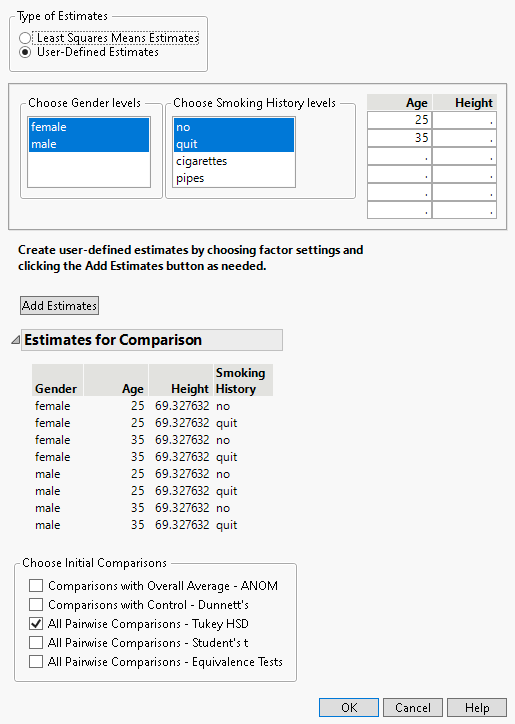
7. From the Type of Estimates list, click User-Defined Estimates.
8. From the Choose Gender levels list, select both female and male.
9. From the Choose Smoking History levels list, select no and quit.
10. In the Age list, enter the ages 25 and 35 in the first two rows.
Do not enter any values in the list entitled Height. Because no values for Height are specified, the mean value of the Height column is used in the multiple comparisons report.
11. Click Add Estimates.
Note that all possible combinations of the levels that you specified appear in the Estimates for Comparison report.
12. In the Choose Initial Comparisons list, select All Pairwise Comparisons - Tukey HSD.
Figure 4.46 Populated Used-Defined Estimates Window
13. Click OK.
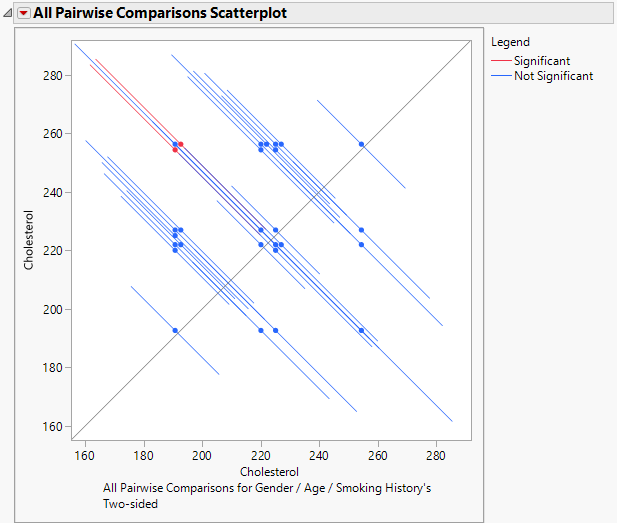
Figure 4.47 All Pairwise Comparisons Scatterplot for User-Defined Comparisons
The All Pairwise Differences report indicates that two of the 28 pairwise comparisons are significant. The All Pairwise Comparisons Scatterplot shows the confidence intervals for these comparisons in red. You can hover over any of the points to determine which pairwise comparison the point represents. The tooltips also contain the difference between the two levels in the comparison. The two red points represent the points comparing 35-year-old former smokers to 25-year-old non-smokers, for both females and males.

