Example of Type 1 Gauge Analysis
Perform a Type 1 Gauge analysis to evaluate the repeatability of a measurement system.
1. Select Help > Sample Data Folder and open Variability Data/Type 1 Gauge MSA.jmp.
2. In the Columns section of the data table, click the asterisk next to Y1 and select MSA.
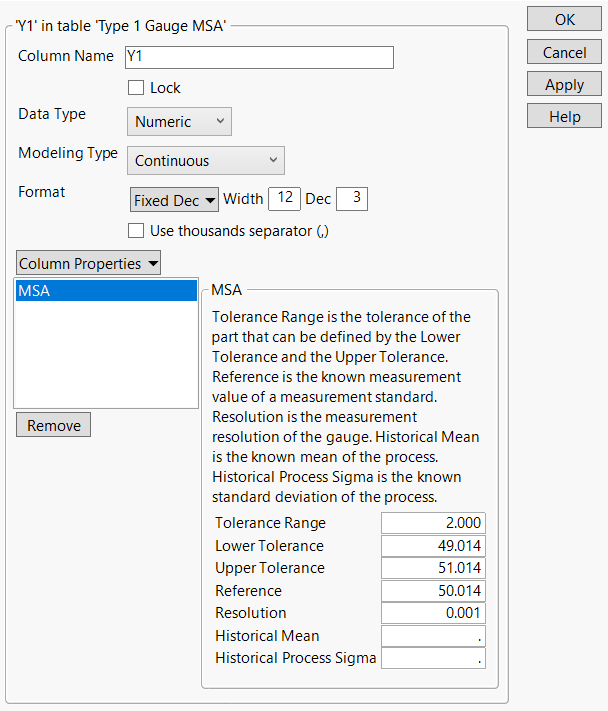
Figure 5.2 MSA Column Property
The Y1 column has an MSA column property, which contains metadata that is used in the Type 1 Gauge Analysis. The metadata includes tolerance specifications, the measurement resolution, and the reference value or the known value of the process quality variable. In this example, the reference value is 50.014.
3. Click Cancel to close the Column Info window.
4. Select Analyze > Quality and Process > Measurement Systems Analysis.
5. Ensure that the MSA Method is set to Type 1 Gauge.
6. In the Show Type 1 Gauge Metadata Entry Dialog, select If Needed.
7. Select Y1 and click Y, Response.
8. Click OK.
9. Click the Run Chart red triangle and select Show Mean.
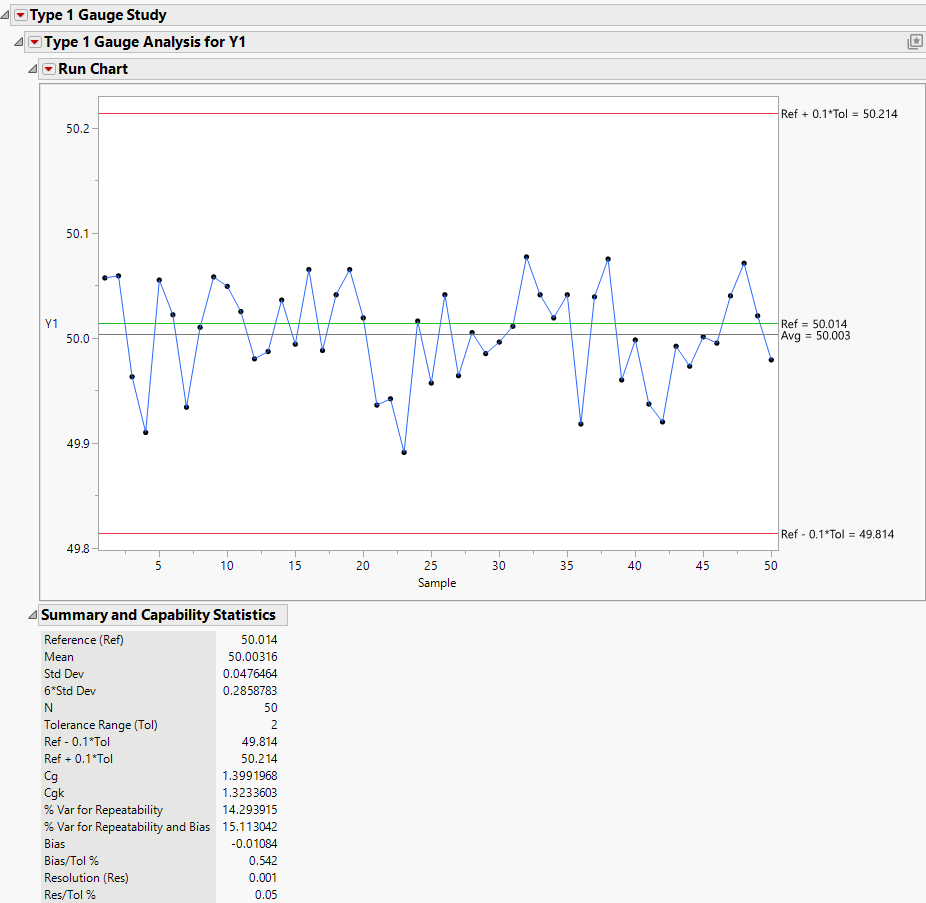
Figure 5.3 Type 1 Gauge Analysis for Y1 Report
The Run Chart shows that the mean of the observed measurements is close to the reference standard and all of the measurements are within the percent of tolerance*tolerance range. The run chart also shows the variability of the measurements. To understand the measurement variability, review the Summary and Capability Statistics table. The values for Cg and CgK are 1.399 and 1.323, respectively. These values are close to the ideal Cg and CgK values of 1.33 or greater. Therefore, this measurement system is considered to be repeatable.

