Inverse Prediction
In the Degradation platform, use the Inverse Prediction tab to predict the time at which the Y variable reaches a specified value. These times are sometime called pseudo failure times.
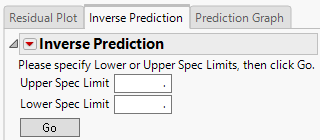
Figure 16.13 Inverse Prediction Tab
Enter either the Lower or Upper Spec Limit. Generally, if your Y variable decreases over time, then enter a Lower Spec Limit. If the Y variable increases over time, then enter an Upper Spec Limit.
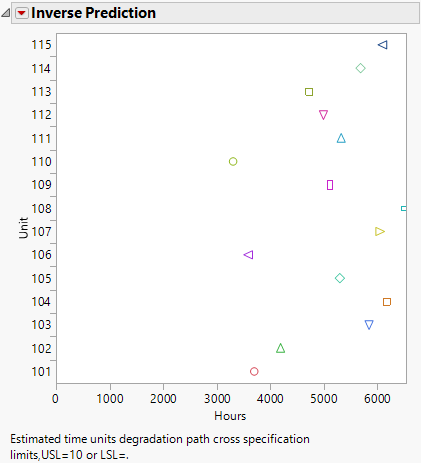
For the GaAs Laser example, enter 10 for the Upper Spec Limit and click Go. A plot is produced showing the estimated times until the units reach a 10% increase in operating current.
Figure 16.14 Inverse Prediction Plot
The Inverse Prediction red triangle menu contains the following options:
Save Crossing Time
Saves the pseudo failure times for the current model to a new data table. The new data table contains a Life Distribution or Fit Life by X script that can be used to fit a distribution to the pseudo failure times. When one of the Inverse Prediction Interval options is enabled, the table also includes the intervals.
Set Upper Spec Limit
Specifies the upper specification limit. Specification limits appear on the Overlay plots.
Set Lower Spec Limit
Specifies the lower specification limit. Specification limits appear on the Overlay and Inverse Prediction plots.
Set Censoring Time
Specifies the censoring time, which appears on the Overlay and Inverse Prediction plots as a dotted vertical line. When No Interval is selected for the Inverse Prediction Interval option, observations that exceed the Censoring Time are displayed on horizontal lines starting at the Censoring Time. If Confidence Interval or Prediction Interval is selected for the Inverse Prediction Interval option, horizontal lines extend indefinitely to the right of observations whose upper limits exceed the Censoring Time. The Censoring Time is reflected in data tables that are created using the Save Crossing Time and Generate Pseudo Failure Data options.
Use Interpolation through Data
Specifies the use of linear interpolation between points (instead of the fitted model) to predict when a unit crosses the specification limit. The behavior depends on whether a unit has observations that exceed the specification limit.
– If a unit has observations exceeding the specification limit, the inverse prediction is the linear interpolation between the observations that surround the specification limit.
– If a unit does not have observations exceeding the specification limit, the inverse prediction is censored and has a value equal to the maximum observed time for that unit.
Inverse Prediction Interval
Shows or hides confidence or prediction intervals for the pseudo failure times that are shown on the Inverse Prediction plot. When intervals are enabled, the intervals are also included in the data table that is created when using the Save Crossing Time option.
Inverse Prediction Alpha
Specifies the alpha level that is used for the intervals in the Inverse Prediction plot.
Inverse Prediction Side
Specifies whether one-sided or two-sided intervals are shown in the Inverse Prediction plot.

