K Nearest Neighbors Report
The K Nearest Neighbor Outliers report in the Explore Outliers platform contains plots for select values of k up to the value K. The value of k for each plot is displayed in its vertical axis label. It is of the form Distance to Neighbor k = <a>, where a is an integer denoting the ath closest neighbor. Each plot shows the distance from the point in the ith row to its ath nearest neighbor. The points that have large distances from their neighbors, across multiple values of k, are likely to be outliers.
The buttons above the plots do the following:
Exclude Selected Rows
Excludes rows corresponding to selected points from further analysis. The rows are assigned the Excluded row state in the data table. You are asked if you want to rerun or close the K Nearest Neighbors report. Rerunning the analysis identifies new nearest neighbors. The plots are updated and the excluded points are not shown.
Note: The Exclude Selected Rows option is not supported within the Local Data Filter or with the Auto Recalc option turned on.
Scatterplot Matrix
Opens a separate window containing a scatterplot matrix for all columns in the analysis. You can explore potential outliers by selecting them in the K Nearest Neighbors plots and viewing them in the scatterplot matrix.
Save NN Distances
Saves the distances from each row to its nth nearest neighbor as new columns in the data table.
Close
Closes the K Nearest Neighbors report.
Largest Outliers
The K Nearest Neighbors report also includes a Largest Outliers table. This table contains the 20 observations with the largest distances from their Kth nearest neighbor. The table has the following columns:
Row
The row number of the observation.
Distance
The distance from the observation in the specified row and its Kth nearest neighbor. The table is sorted by this column in descending order.
Nearest Neighbors
Lists the row numbers for the k nearest neighbors. The first row number is the closest nearest neighbor. The last row number is the Kth nearest neighbor and the distance between this observation and the specified row is found in the Distance column.
Col<n>
Specifies the column name for the corresponding RMS value.
RMS<n>
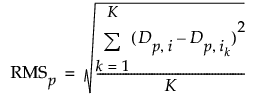
The root mean squared differences across the k nearest neighbors for each column. The largest RMS values are displayed in order, where RMS1 is the maximum RMS value. The pth RMS value is calculated as follows:

where
Dp is the pth column
Dp,i is the value of the pth column for row i
Dp,ik is the value of the pth column for the kth nearest neighbor of row i
Note: The number of Col and RMS columns shown in the Largest Outliers table is the minimum of the number of columns specified in the launch and the number five.