Launch the Fit Curve Platform
To launch the Fit Curve platform, select Analyze > Specialized Modeling > Fit Curve.
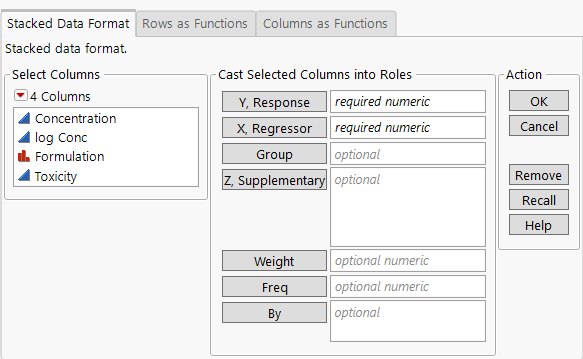
Figure 14.6 Fit Curve Platform Launch Window
For more information about the options in the Select Columns red triangle menu, see Column Filter Menu in Using JMP.
Select Data Format
The Fit Curve launch window includes tabs for different types of data formats. Select the tab based on your data format.
Stacked Data Format
Select for data tables where each row corresponds to a single observation. There are separate columns for the response, regressors, and group variables.
Rows as Functions
Select for data tables where each row corresponds to the full response function for one level of the Group variable. Each column corresponds to a level of the regressor variable.
Tip: If the columns contain the FDE X column property, the column property is used to specify the x values. If the columns do not contain the column property, the Rows as Functions data format uses the levels of the x values specified in the column names. If the column name is too complicated, an error message is shown to indicate which columns were problematic and the x values are specified as x = 1, 2, ..., n, where n is the number of observations.
Columns as Functions
Select for data tables where each column corresponds to the entire response function for one level of the Group variable. Each row corresponds to a level of a regressor variable.
Specify Column Roles
The launch window contains the following options for specifying the column roles.
Y, Response
Specifies the Y variable.
X, Regressor
(Available only for the Stacked Data Format and Columns as Functions tabs.) Specifies the X variable.
Group
(Available only for the Stacked Data Format and Rows as Functions tabs.) Specifies a grouping variable. The fitted model has separate parameters for each level of the grouping variable. This enables you to compare fitted models and estimated parameters across the levels of the grouping variable.
Z, Supplementary
(Available only for the Stacked Data Format and Rows as Functions tabs.) Specifies one or more supplementary variables. Supplementary variables are not used in any of the calculations in the Fit Curve platform and including them does not affect the results. Supplementary variables are variables that you might want to use in future analyses of the results from Fit Curve. When you specify supplementary variables, they are included in the table that is created by the Make Parameter Table option. In JMP Pro, if you specify one or more supplementary variables and a grouping variable, a Curve DOE Analysis option is made available for the fitted models. See Curve DOE Analysis.
Weight
Specify a variable that contains the weights of the observations.
Freq
(Available only for the Stacked Data Format tab.) Specifies a variable that contains the frequencies of the observations.
By
Specifies a variable to perform a separate analysis for every level of the variable.
