Limits Table
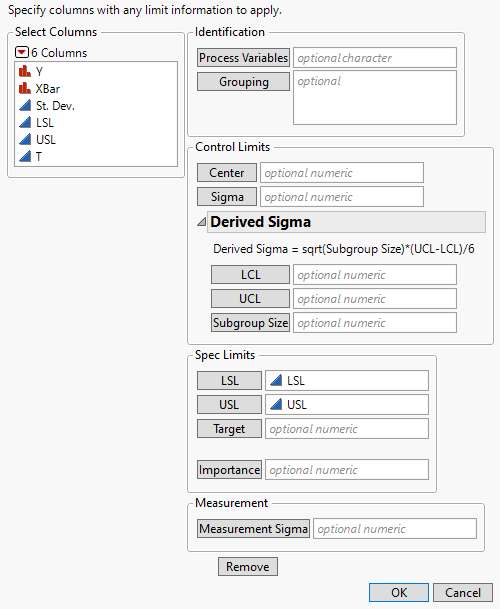
A Limits Table contains a row for each process defined by the Process Variables and Grouping variables in your table of process data. When you use a Limits Table in the Process Screening platform, the Limits Specifications window enables you to specify variables with the roles listed below. You do not need to specify variables for all of these roles. All of these roles are optional.
Figure 8.6 Limits Specifications Window
Columns in the Limits Table that have appropriate names or names that match the role buttons are auto-filled. For example, any column called “Process”, “Column”, or “Parameter” is auto-filled into the Process Variables list.
If you have control limits but do not have columns for Center or Sigma, then you can use the Derived Sigma options.
Process Variables
A column that contains values corresponding to the column names in your table of process data.
Grouping
One or more columns that contain the values of the grouping variables for your table of process data.
Center
A column containing values for the center line for each process. This is usually the historical process mean.
Sigma
A column containing values for the within standard deviation for each process. This is usually the historical standard deviation. This is labeled as Specified Sigma in the Process Screening report.
Derived Sigma
Calculates sigma based on the given control limits and subgroup size. This is labeled as Specified Sigma in the Process Screening report.
Note: If there is a specified sigma, the within-sigma, stability index, and stability ratio values do not match between the Process Screening and Control Chart Builder platforms. The Process Screening platform uses the specified sigma to calculate the control limits, but still calculates the within-sigma using the data. The Control Chart Builder platform uses the specified sigma as the historical sigma and in control charts, the historical sigma is used as the within-sigma.
The derived sigma is calculated as follows:
Sigma = d*(UCL - LCL)/6
where d is the square root of the subgroup size.
LCL
A column containing the lower control limits for each process.
UCL
A column containing the upper control limits for each process.
Subgroup Size
A column containing the subgroup size for each process.
LSL
A column containing lower specification limits for each process.
USL
A column containing upper specification limits for each process.
Target
A column containing a target value for each process.
Importance
A column containing an importance value for each process. The Importance column provides a mechanism to sort processes in the order that you prefer.
Measurement Sigma
A column containing the measurement sigma for each process.
