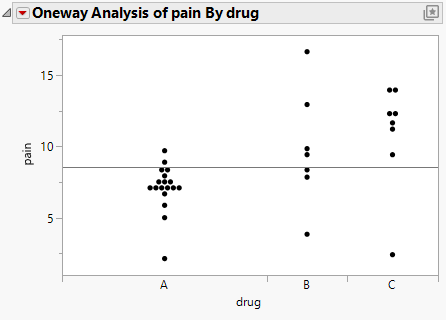
Oneway Report
The Oneway report initially contains a scatterplot for each pair of nominal or ordinal X variables and continuous Y variables. You can fit models, perform hypothesis tests, perform equivalence tests, compare distributions, and view statistical reports using the red triangle options. See The Oneway Platform Options.
Note: If a Block variable is specified in the launch window, the values of the Y variable in the Oneway plot are centered by the Block variable. The options that are available differ for analyses with blocks.
Figure 6.5 Oneway Plot
Note: Any rows that are excluded in the data table are also hidden in the Oneway plot.
Replace Variables Interactively
You can also replace a variable by selecting a variable in the Columns panel of the associated data table and dragging it onto an axis.
