Publication date: 06/27/2024
Scripting Tools
Use the Script Editor, Log Window, Debugger, and Profiler
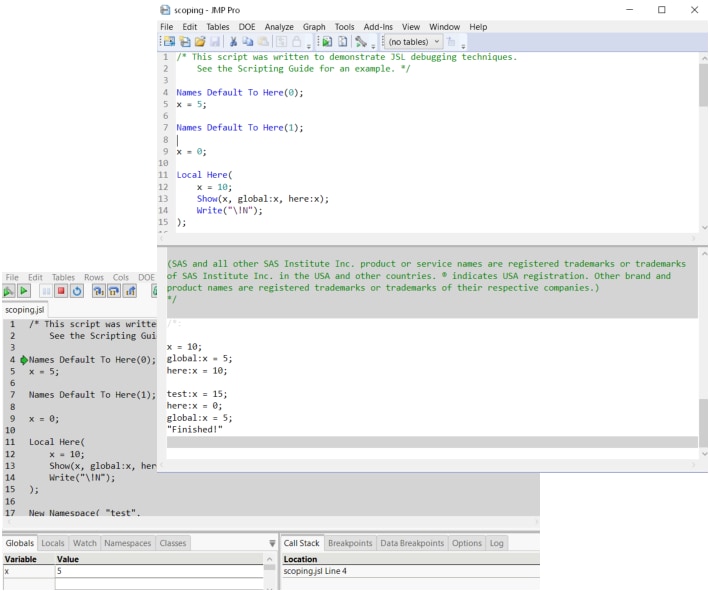
JMP provides several programming tools for script writers. The script editor supports syntax coloring, autocompletes functions as you type, highlights matching braces, allows for code folding, and has additional features to help you develop scripts more quickly. Error messages and output are shown in the log window, which can be displayed inside the script editor. The JMP Scripting Language (JSL) Debugger and Profiler can help you troubleshoot your scripts.
Figure 4.1 Script Editor with Embedded Log and the Debugger
Contents
Work with the Script Editor
Introduction to the Script Editor
Run a Script
Stop a Script
Edit a Script
Color Coding and Themes
Autocomplete Functions
Tooltips in Scripts
Split the Script Editor Window
Match Parentheses, Brackets, and Braces
Select a Rectangular Block of Text
Select Fragmented Text
Drag and Drop Text
Find and Replace Text
Automatic Formatting and Reformatting
Errors Are Marked by Special Characters
Type in Multiple Rows at Once
Add Code Folding Markers
Advanced Options in the Script Editor
Set Preferences for the Script Editor
Work with the Log
Enhanced Log in JMP
Text Log in JMP
Debug or Profile Scripts
Debugger and Profiler Window
Work with Breakpoints
View Variables and Values
Work with Watch Variables
Modify Preferences in the Debugger
Persistent Debugger Sessions
Examples of Debugging and Profiling Scripts
Want more information? Have questions? Get answers in the JMP User Community (community.jmp.com).
