 Specification Window
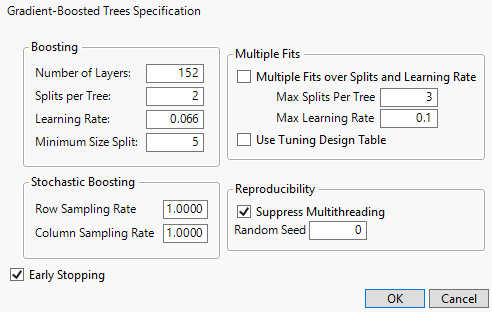
After you select OK in the Boosted Tree launch window, the Gradient-Boosted Trees Specification window appears.
Figure 6.7 Boosted Tree Specification Window
 Boosting Panel
Number of Layers
The maximum number of layers to include in the final tree.
Splits per Tree
The number of splits for each layer.
Learning Rate
A number such that 0 < r ≤ 1. Learning rates close to 1 result in faster convergence on a final tree, but also have a higher tendency to overfit data. Use learning rates closer to 1 when a small Number of Layers is specified. The learning rate is a small fraction typically between 0.01 and 0.1 that slows the convergence of the model. This preserves opportunities for later layers to use different splits than the earlier layers.
Overfit Penalty
(Available only for categorical responses.) A biasing parameter that helps protect against fitting probabilities equal to zero.See Statistical Details for the Overfit Penalty.
Minimum Size Split
The minimum number of observations needed on a candidate split.
 Multiple Fits Panel
Multiple Fits over Splits and Learning Rate
If selected, creates a boosted tree for every combination of Splits per Tree (in integer increments) and Learning Rate (in 0.1 increments).
The lower bounds for the combinations are specified by the Splits per Tree and Learning Rate options. The upper bounds for the combinations are specified by the following options:
Max Splits per Tree
Upper bound for Splits per Tree.
Max Learning Rate
Lower bound for Learning Rate.
Use Tuning Design Table
Opens a window where you can select a data table containing values for some tuning parameters, called a tuning design table. A tuning design table has a column for each option that you want to specify and has one or multiple rows that each represent a single Boosted Tree model design. If an option is not specified in the tuning design table, the default value is used.
For each row in the table, JMP creates a Boosted Tree model using the tuning parameters specified. If more than one model is specified in the tuning design table, the Model Validation-Set Summaries report lists the R-Square value for each model. The Boosted Tree report shows the fit statistics for the model with the largest R-Square value.
You can create a tuning design table using the Design of Experiments facilities. For example, use a Custom or a Space Filling Design. See Additional Example of the Bootstrap Forest Platform. A boosted tree tuning design table can contain the following case-insensitive columns in any order:
– Number of Layers
– Splits per Tree
– Learning Rate
– Minimum Size Split
– Row Sampling Rate
– Column Sampling Rate
 Stochastic Boosting Panel
Row Sampling Rate
Proportion of training rows to sample for each layer.
Note: When the response is categorical, the training rows are sampled using stratified random sampling.
Column Sampling Rate
Proportion of predictor columns to sample for each layer.
 Reproducibility Panel
Suppress Multithreading
If selected, all calculations are performed on a single thread.
Random Seed
Specify a nonzero numeric random seed to reproduce the results for future launches of the platform. By default, the Random Seed is set to zero, which does not produce reproducible results. When you save the analysis to a script, the random seed that you enter is saved to the script.
 Early Stopping
Early Stopping
If selected, the boosting process stops fitting additional layers when the additional layers do not improve the validation statistic. If not selected, the boosting process continues until the specified number of layers is reached. This option appears only if validation is used.
