Publication date: 06/27/2024
Specify Transparency in JMP Graphs
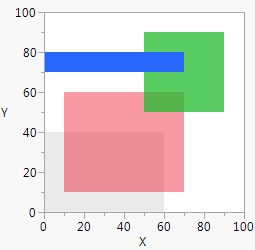
In a graphics environment (like a Frame Box), use the Transparency function to set the level of transparency. The argument, alpha, can be any number between zero and one. The value 0 means clear and drawing has no effect. The value 1 means completely opaque and is the usual drawing mode. Intermediate values build semi-transparent color layers on top of what has already been drawn below it. The following example script illustrates transparency with rectangles.
win = New Window( "Transparency",
Graph Box(
Frame Size( 200, 200 ),
Pen Color( "gray" );
Fill Color( "gray" );
Transparency( 0.25 );
Rect( 0, 40, 60, 0, 1 );
Pen Color( "red" );
Fill Color( "red" );
Transparency( 0.5 );
Rect( 10, 60, 70, 10, 1 );
Pen Color( "green" );
Fill Color( "green" );
Transparency( 0.75 );
Rect( 50, 90, 90, 50, 1 );
Pen Color( "blue" );
Fill Color( "blue" );
Transparency( 1 );
Rect( 0, 80, 70, 70, 1 );
)
);
Figure 12.20 Transparency and Rectangles
Want more information? Have questions? Get answers in the JMP User Community (community.jmp.com).
