Statistical Details for Contributions
This section contains computations for the contribution statistics in the Model Driven Multivariate Control Chart platform.
T2
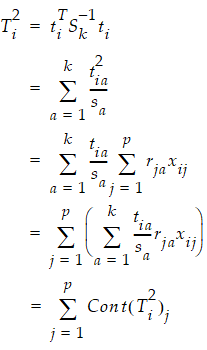
The T2 contributions for a PCA or PLS model with p variables and k components are calculated as:

where:
ti = the vector of k scores for the ith observation
Sk = the diagonal sample covariance matrix of the k scores for historical observations. For PCA models, Sk is the diagonal eigenvalue matrix.
sa = the ath diagonal element of Sk
rja = the jth element of the ath eigenvector for PCA models and the ath column of the Rk loading matrix for PLS models. Rk is the matrix used to relate the score matrix, Tk to the X matrix, such that Tk=XRk.
xij = the value of the jth variable for the ith observation.
Note: The p terms in the last sum are the variable contributions.
The contribution of each variable is the sum of its contribution to each score, weighted by the normalized score value. A variable is considered to have a large contribution to  if there is a large normalized score value, and the variable contribution is large.

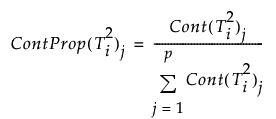
the contribution proportion of variable j is defined as:

Note: When computing T2 contribution proportions, JMP zeros out negative contributions. Negative contributions are possible due to the interaction of variables during the projection of X in PCA and PLS models. The negative contributions are zeroed in order to identify the variable contributions that represent a large proportion of the total positive contributions.
For more information about PCA contributions and negative contributions, see Kourti and MacGregor (1996). For more information about PLS contributions, see Li et al. (2009).
DModX
For PCA and PLS models, the contribution of variable j to DModXi is defined as:

Note that since

the contribution proportion of variable j is defined as:

SPE
For PCA and PLS models, the contribution of variable j to SPEi is defined as:

Note that since

the contribution proportion of variable j is defined as:

Score Contributions
The score contribution computation is the same as T2 contributions but are computed only for the dimensions selected in the score plot.