The Repeated Measures Degradation Report
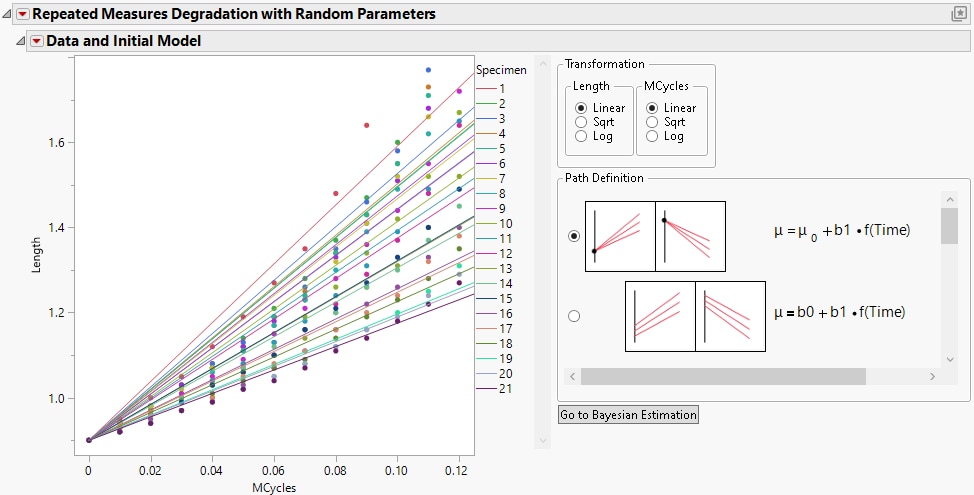
The Repeated Measures Degradation with Random Parameters report shows a plot of the data and a graphical representation of the model that is specified based on the selections of Transformations and Path Definition.
Figure 8.8 Repeated Measures Degradation Plot and Options
Note the following about the plot:
• Data values are represented by markers. Censored observations are denoted with triangles.
• Each level of the Label, System ID variable is listed in the legend to the right of the plot. By default, when you select one or more levels in the legend, only the selected levels in the plot are shown. You can change the behavior to dimming instead of hiding by deselecting the Hide to Deemphasize option in the Data and Initial Model red triangle menu.
• The plot contains an initial model line, or path, for each level of the Label, System ID variable. These paths update based on the selections for the options on the right side of the report. You can hide them by deselecting the Show Initial Fitted Curves option in the Data and Initial Model red triangle menu.
The model that is shown in the graph is specified by transformations and path definitions. There are options in the Data and Initial Model report that enable you to make these specifications.
Transformation
Choose a transformation function for the response Y and for the Time variable.
Note: If you apply the Sqrt transformation to a column that contains negative values, the rows with negative values are omitted from the model fit. If you apply the Log transformation to a column that contains nonpositive values, the rows with nonpositive values are omitted from the model fit.
Path Definition
Choose a linear or a nonlinear path for the regression model. For more information about each model, see Models.
Go to Bayesian Estimation
A new Response report is created each time you click the Go to Bayesian Estimation button for a new path definition and transformation combination. The Response report enables you to specify prior distribution information for the model and then start the Markov chain Monte Carlo (MCMC) procedure.
