Example of SEM for Summarized Data Tables
The Structural Equation Models (SEM) platform can fit a variety of models using summarized data without needing individual-level data. A summarized data table is a condensed version of raw data where the observations have been aggregated. For example, a correlation or covariance matrix is used to represent the relationships between variables rather than showing individual data points.
In this example, you use a summarized data table with the SEM platform to fit a bi-factor model and assess the measurement model. The summarized data table includes the classic correlation matrix published by Holzinger and Swineford (1937). This matrix contains correlations among 14 observed variables that are related to cognitive ability. The bi-factor model has a general cognitive ability factor and multiple specific factors (spatial, mental, motor, and verbal abilities). You can use the Assess Measurement Model option to estimate the reliability of construct using Hierarchical Omega and evaluate properties of the scale.
1. Select Help > Sample Data Folder and open Cognitive Ability I.jmp.
2. Select Analyze > Multivariate Methods > Structural Equation Models.
3. On the Summarized Data Format tab, select Visual Perception I through Vocabulary Test and click Model Variables.
4. In the Options panel, enter 355 in the Sample Size box.
Note: The correlation matrix and sample size are sufficient to launch the SEM platform in summarized data mode. If the summarized data table includes Mean and Std Dev columns, select them in the Select Columns panel and click Mean and Std Dev in the Cast Selected Columns into Roles panel.
5. Click OK.
The Structural Equation Models report Model Specification outline appears.
6. Select Visual Perception I through Visual Perception III in the To List, type Spatial Ability in the box below the To List, and click the add latent variable ![]() button.
button.
7. Select Grey’s Test through Mental Speed 2 in the To List, type Mental Speed in the box below the To List, and click the add latent variable ![]() button.
button.
8. Select Motor Speed Tapping through Speed Writing Words in the To List, type Motor Speed in the box below the To List, and click the add latent variable ![]() button.
button.
9. Select Verbalized Relations through Vocabulary Test in the To List, type Verbal Ability in the box below the To List, and click the add latent variable ![]() button.
button.
10. Select Visual Perception I through Vocabulary Test in the To List, type General Cognitive Ability in the box below the To List, and click the add latent variable ![]() button.
button.
11. Click Run.
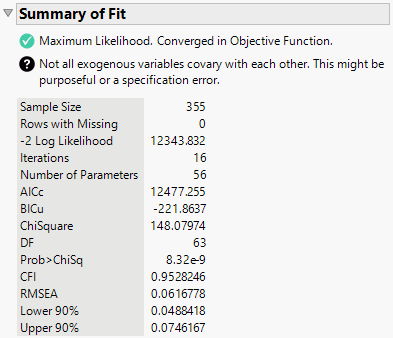
Figure 8.16 Summary of Fit for Summarized Data Format
The Structural Equation Models report that appears includes Summary of Fit and Parameter Estimates tables. The Summary of Fit table shows a good overall fit for the bi-factor model. The CFI value of 0.953 and RMSEA value of 0.062 both indicate that the model provides a reasonable approximation of the data.
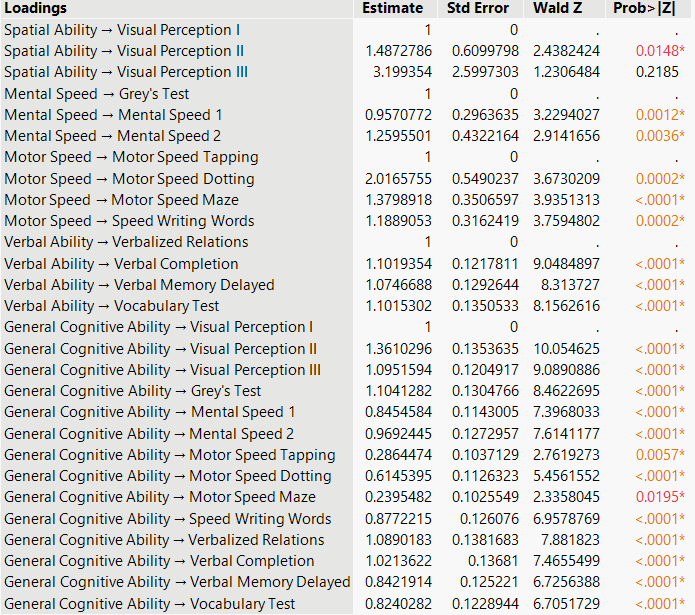
Figure 8.17 Parameter Estimates for Summarized Data Format
The unstandardized loadings shown in the Parameter Estimates report indicate that General Cognitive Ability significantly influences most of the observed variables across different cognitive domains. The specific factors (Spatial Ability, Mental Speed, Motor Speed, and Verbal Ability) also have significant influences on their respective indicators, though the strength of these relationships varies.
Tip: To view the standardized loadings, select the Standardized Parameter Estimates option in the red triangle menu next to Structural Equation Model: Model 1. Standardized loadings range from -1 to 1 and provide clarity on the strength of associations of indicators with their latent variables.
12. Click the red triangle next to Structural Equation Model: Model 1 and select Assess Measurement Model.
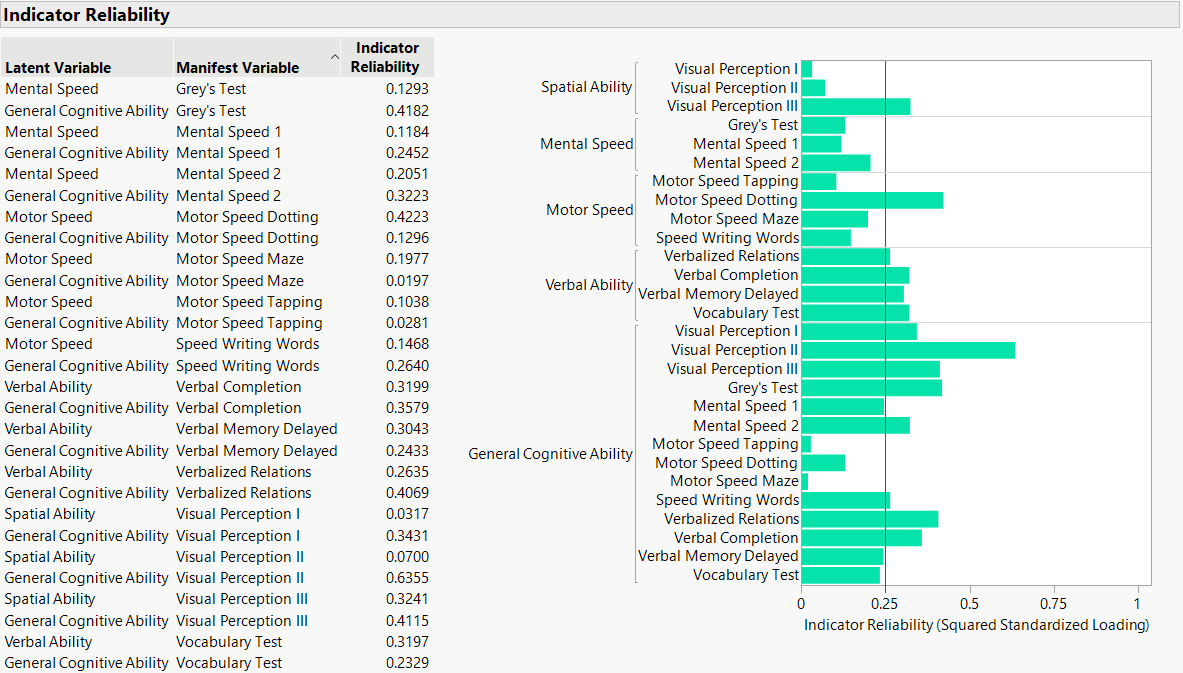
Figure 8.18 Indicator Reliability Report
The Indicator Reliability report shows reliability estimates for each indicator. These values are also represented in the bar chart and indicate that the General Cognitive Ability latent variable consistently explains a large portion of the variance in most of the cognitive ability tests. This suggests that it is a key factor that influences performance across different domains. Scores on the motor speed tasks are the only exception, which suggests that these tasks are not represented by the general factor. The specific latent variables Mental Speed, Motor Speed, Verbal Ability, and Spatial Ability show varying levels of indicator reliability, with some manifest variables (such as Motor Speed Dotting and Verbal Completion) that are better explained than others. Finally, low indicator reliability values for specific latent variables, such as those for the indicators of Mental Speed, suggest that some tasks are better indicators of general ability than their specific factors, such as Visual Perception I and Grey’s Test. Tasks like Motor Speed Tapping that have low reliability for the general and corresponding specific factor indicate potential measurement issues.
Figure 8.19 Composite Reliability Report
The Composite Reliability table contains Omega (Hierarchical) values for different latent variables. The Hierarchical Omega values measure the reliability of the latent constructs in the context of a bi-factor model. The Hierarchical Omega indicates how well the latent variables (specific and general) in a bi-factor model account for the variance in the observed indicators. Omega values range from 0 to 1 and higher values indicate greater reliability. According to this table, General Cognitive Ability (Omega = 0.8791) is the most reliable factor in this model, and it explains a large portion of the variance across many indicators. Verbal Ability (Omega = 0.7566) is also highly reliable, and it shows strong explanatory power for its corresponding verbal-related tasks. However, Motor Speed, Spatial Ability, and Mental Speed have lower Omega values, which indicate that they are less reliable in accounting for the variance in their respective indicators.


