公開日: 09/19/2023
テキストを追加する
Text()を使うと、グラフの任意の位置にテキストを表示できます。
Text( <properties>, ( {x, y}|{left, bottom, right, top} ), "text" );
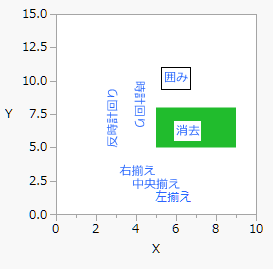
位置とテキストは、任意の順序でいくつでも指定できます。座標とテキストの引数に加えて、最初の引数に、Center Justified(中央揃え)、Right Justified(右揃え)、Erased(消去)、Boxed(囲み)、Counterclockwise(反時計回り)、Clockwise(時計回り)をオプションで指定できます。Erasedは、グラフ内のテキストを見にくくするものを削除するためのコマンドです。テキストの背後に背景色付きの長方形を作成します。
以下の例で、Erasedを指定したテキストが、緑の長方形の上の白いボックス内に、どのように表示されるかを見てください。
mytext = New Window( "テキストの追加",
Graph Box(
Frame Size( 200, 200 ),
Y Scale( 0, 15 ),
X Scale( 0, 10 ),
Text Size( 9 );
Text Color( "blue" );
Text( {5, 1}, "左揃え" );
Text( Center Justified, {5, 2}, "中央揃え" );
Text( Right Justified, {5, 3}, "右揃え" );
Fill Color( 4 );
Rect( 5, 8, 9, 5, 1 );
Text( Erased, {6, 6}, "消去" );
Text( Boxed, {6, 10}, "囲み" );
Text( Clockwise, {4, 10}, "時計回り" );
Text( Counterclockwise, {3, 5}, "反時計回り" );
)
);
図12.19 グラフボックス内にテキストを描く
Text()関数は、4つの座標値を引数として、その枠の中に文字列を描くこともできます。構文は次のとおりです。
Text( {left, top, right, bottom}, string);より詳細な情報が必要な場合や、質問があるときは、JMPユーザーコミュニティで答えを見つけましょう (community.jmp.com).
