Add Scripts to Graphs
When you right-click a graphics frame, you can enter or paste JSL commands as shown in the following example. The script usually contains drawing commands that run in the context of the graphics frame. The context of the graphics frame includes the data range of the axes and the order that the data and scripts are drawn in.
1. Select Help > Sample Data Library and open Big Class.jmp.
2. Select Analyze > Fit Y by X.
3. Choose weight for Y and height for X, and then click OK.
4. Right-click inside the graph and select Customize.
Figure 12.1 Customizing the Graph Options
5. Click the Add button  to add a new graphics script.
6. Type the following text and click OK.
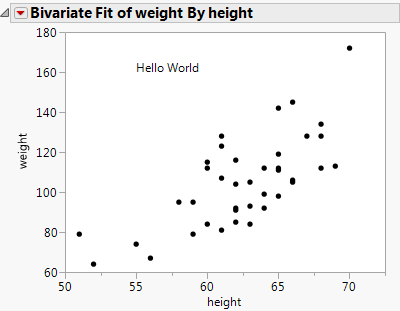
Text( {55, 160}, "Hello World" );Now the graph has a text element at the graph’s x-coordinate 55 and y-coordinate 160.
Figure 12.2 Adding a Script to a Graph Interactively
By default, the data points appear on top of graphics.
For example, add a new script in the Customize Graph window:
Fill Color( "Green" ); Rect( 57, 175, 65, 110, 1 );
A solid green rectangle appears. The list of scripts shows the order in which each script is drawn, so the first item on the list is drawn first.
• If you want the rectangle behind everything, move the rectangle script above the text script: select the rectangle script and click the up button  .
.
• If you want the rectangle on top of everything, select the rectangle script and click the down button  .
.
You can arrange all the scripts in a graph into the drawing order that you prefer. Any new script is initially added directly after the item in the list that is selected.
Tip: To use a script that references a column name, use Column( colname ) or a colon ( :colname ) to scope it properly.
Hint: To see the JSL for the above actions, select Save Script > To Script Window from the red triangle menu.

