发布日期: 04/13/2021
Scripting Tools
Using the Script Editor, Log Window, Debugger and Profiler
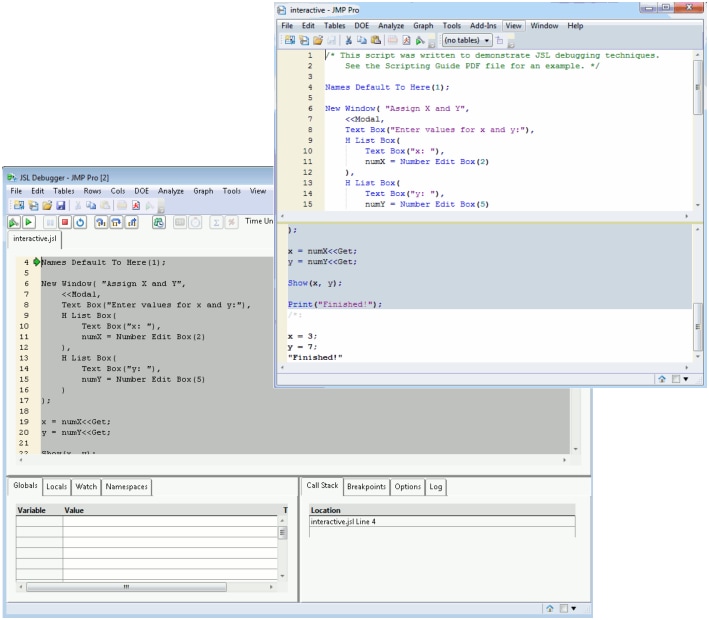
JMP provides several programming tools for script writers. The script editor supports syntax coloring, autocompletes functions as you type, highlights matching braces, allows for code folding, and has additional features to help you develop scripts more quickly. Error messages and output are shown in the log window, which can be displayed inside the script editor. The JMP Scripting Language (JSL) Debugger and Profiler can help you troubleshoot your scripts.
Figure 4.1 Script Editor with Embedded Log and the Debugger
Contents
Using the Script Editor
Introduction to the Script Editor
Run a Script
Stop a Script
Edit a Script
Color Coding and Themes
Auto Complete Functions
Tooltips
Split a Window
Match Parentheses, Brackets, and Braces
Select a Rectangular Block of Text
Select Fragmented Text
Drag and Drop Text
Find and Replace
Automatic Formatting
Add Code Folding Markers
Advanced Options
Set Preferences for the Script Editor
Working with the Log
Show the Log in the Script Window
Save the Log
Debug or Profile Scripts
Debugger and Profiler Window
Work with Breakpoints
View Variables
Work with Watches
Modify Preferences in Debugger
Persistent Debugger Sessions
Examples of Debugging and Profiling Scripts
需要更多信息?有问题?从 JMP 用户社区得到解答 (community.jmp.com).
