Capture a Script for an Analysis Report
Here are the basic steps for capturing a script to reproduce an JMP analysis:
1. Launch a platform, such as Distribution.
2. Make any changes or additions that you need. For example, add tests and other graphs.
3. Capture the script to recreate your results.
You can save the script in the data table, so that if you send the data table to others, they can run your script and duplicate your reports.
Example
Follow these steps to produce a distribution report, capture the script to reproduce it, and save it to the data table.
Note: The data tables that you use in examples are located in JMP’s Samples/Data folder.
1. Select Help > Sample Data Folder and open Companies.jmp.
2. Select Analyze > Distribution to open the Distribution launch window.
3. Select Profits ($M) in the Select Columns box and click the Y, Columns button.
4. Click OK.
The Distribution report window appears.
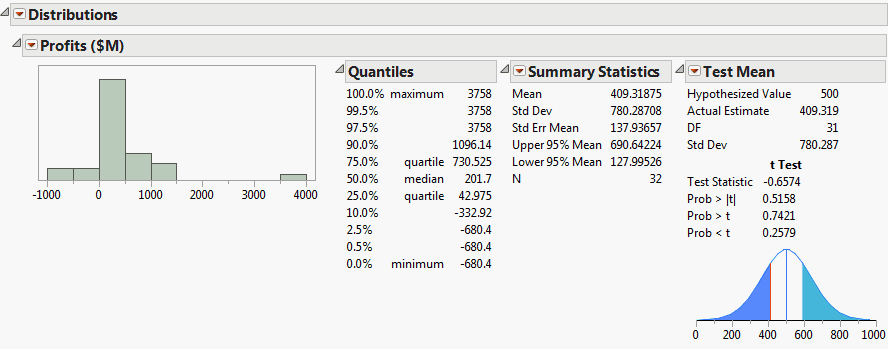
5. Click the Distributions red triangle and select Stack to make your report horizontal.
6. Click the red triangle next to Profits ($M) and deselect Outlier Box Plot to turn the option off.
7. Click the red triangle next to Profits ($M) and select Test Mean.
The Test Mean window appears.
8. Type 500 in the Specify Hypothesized Mean box.
9. Click OK.
The test for the mean is added to the report window.
Now you have your customized report.
Figure 3.1 Customized Distribution Report
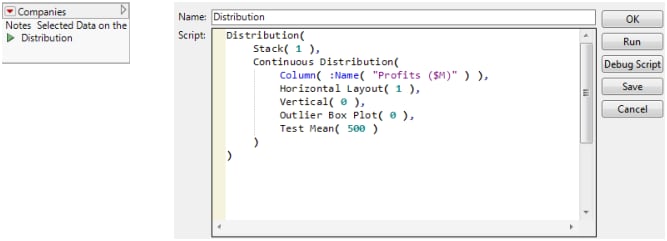
10. Click the Distributions red triangle and select Save Script > To Data Table.
Your data table now has a script named Distribution saved to it. Right-click the Distribution script and select Edit to see the script.
Figure 3.2 Distribution Script Saved to the Data Table
11. To run the script and reproduce your final report exactly, click the green triangle next to the script.

