该帮助的版本不再更新,请参见https://www.jmp.com/support/help/zh-cn/15.2 获取最新的版本.


Extract Values from Reports.jsl performs a Bivariate analysis and shows results such as the sample size, RSquare, and Correlation in a new report window. 图 17.4 shows the Bivariate report along with the customized report, though the Bivariate report window closes after the script is finished.
sd = Open( "$SAMPLE_DATA/Lipid Data.JMP" );
biv = Bivariate( // biv is the analysis layer.
Density Ellipse( 0.95, {Line Color( {213, 72, 87} )} ),
Fit Line( {Line Color( {57, 177, 67} )} ),
report(biv) [Outline Box( 2 )] << Close( 0 );
reportbiv = biv << Report; // reportbiv is the report layer.
corrvalue = reportbiv[Outline Box( 2 )][Number Col Box( 3 )] << Get( 1 );
sumfit = reportbiv[Outline Box( 4 )][Number Col Box( 1 )] << Get as Matrix;
term = reportbiv[Outline Box( 7 )][String Col Box( 1 )] << Get();
cloneterm = reportbiv[Outline Box( 7 )][String Col Box( 1 )] << Clone Box;
est = reportbiv[Outline Box( 7 )][Number Col Box( 1 )] << Get as Matrix;
stde = reportbiv[Outline Box( 7 )][Number Col Box( 2 )] << Get as Matrix;
dlg = New Window( "Custom Report",
Outline Box( "Selected Values",
/* The Lineup box defines a two-column layout, each of which contains
Lineup Box( N Col( 2 ),
Text Box( "Factor of Interest: " ),
Text Box( sfactor ), ),
tb = Table Box(
/* Display an empty string in the first column
String Col Box( " ",
{"Sample Size: ", "Adjusted RSquare: ", "RSquare: ",
// Insert a 30 pixel x 30 pixel spacer between the columns.
Spacer Box( Size( 30, 30 ) ),
/* Display an empty string in the first column
Number Col Box( " ", dvalues )
// Insert a 1 x 30 spacer.
Spacer Box( Size( 0, 30 ) ),
Table Box(
/* Display the cloned String Col Box followed by a spacer.
Spacer Box( Size( 10, 0 ) ),
Number Col Box( "Estimate", est ),
Spacer Box( Size( 10, 0 ) ),
Number Col Box( "Standard Error", stde )
tb << Set Shade Headings( 0 ); // Turn off shaded table headings.
tb << Set Heading Column Borders( 0 ); // Turn off table column borders.
Close( sd ); // Close the data table.
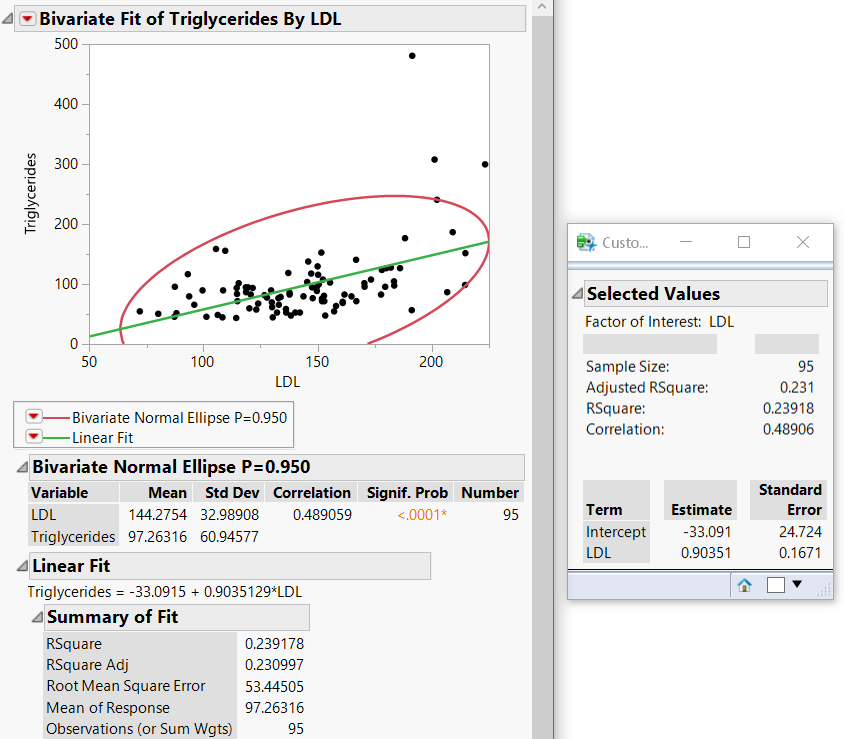
图 17.4 Customized Report from the Bivariate Analysis