该帮助的版本不再更新,请参见https://www.jmp.com/support/help/zh-cn/15.2 获取最新的版本.


dt = Open( "$SAMPLE_DATA/Big Class.jmp" );
biv = dt << Bivariate( Y( weight ), X( height ) ); // a reference to the platform
biv << Fit Spline( 1000000 ) << Fit Mean;
biv << Fit Polynomial( 4, {Line Color( RGBColor( 1, 0.5, 0 ) )}); // degree 4, orange curve
biv << ( Curve[1] << Line Color( red ) ); // first curve is red
4.
Assign rbiv to the report layer:
rbiv[Frame Box( 1 )] << Size Window( 500, 700 );
biv << Scroll Window( {0, 0} );
rbiv = biv << Report; // a reference to the report
Show Properties( rbiv ); // show the properties of the report
注意:The log lists the messages to use with reports. Using Show Properties() is an alternative to the Scripting Index.
rbiv["Fit Mean"] << Close( 0 );
Close() is a Boolean function (true or false), and passing 0 indicates that the outline is not closed.
rbiv["Summary of Fit"] << Select;
rbiv["Parameter Estimates"] << Select;
rbiv["Analysis of Variance"] << Select;
rbiv["Polynomial Fit Degree=4", "Parameter ?", Column Box( "Estimate" )] << Select; // dig down in the outline tree
rbiv << Deselect;
pe = rbiv["Polynomial Fit Degree=4", "Parameter ?"];
ests = pe[Number Col Box( "Estimate" )];
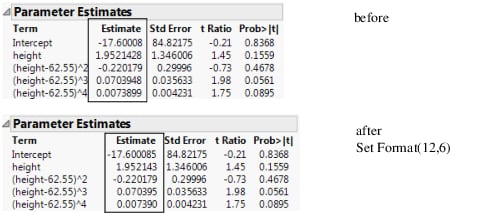
ests << Set Format( 12, 6 );
The first argument to Set Format sets the column width by the number of characters to display. The second argument sets how many decimal places are shown in the table.
图 11.8 Applying Changes to a Report
terms = pe[String Col Box( "Term" )]; // find the Term column
estimate = .; // in case there is no cubic term
For( i = 1, i < 10, i++,
If( Contains( terms << Get( i ), "^3" ),
Break();
Show( estimate );
10.
Use a For() loop to count down to the row for the term that you want. The second argument to For() is a condition; as long as the condition tests true, looping continues. Here the test is “when the string in the Terms column is not "^3" and we have not reached the tenth row.” As soon as the string does match, looping stops and i’s value is the number for the matching row. You then use i as a subscript to the Get message on the Estimates column.
myVector = rbiv[Table Box( 5 )][Number Col Box( "Sum of Squares" )] << Get as Matrix;
dt << New Column( "Sum of Squares", Values( myVector ) );
rbiv[Table Box( 5 )] << Make Data Table( "ANOVA table" );
rbiv[Axis Box( 1 )] << Min( 70 ) << Max( 170 ); // set the Y axis
rbiv[Axis Box( 2 )] << Min( 50 ) << Max( 70 ); // set X axis
rbiv[Picture Box( 1 )] << Copy Picture;