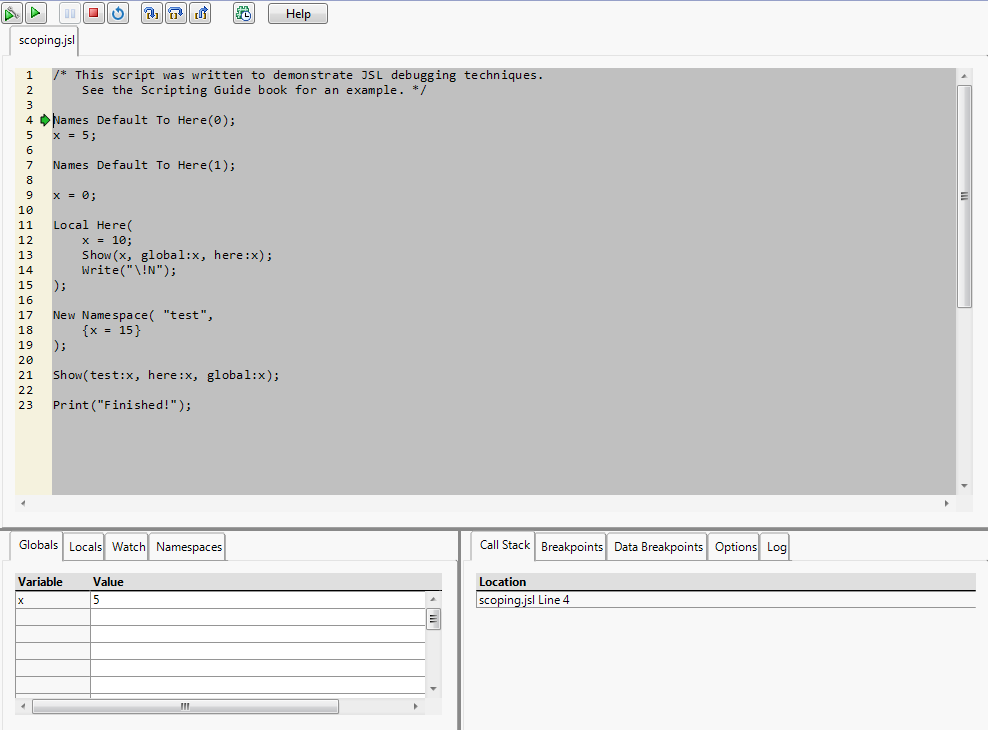
The Debugger opens in a new instance of JMP (图 4.10). The original instance is inoperable until the script produces something that requires interaction. At that point, the Debugger window becomes inoperable until you perform whatever action is required. Then control is returned to the Debugger. Close the Debugger to work again in the original instance of JMP.
提示:To view or edit long values on a tab in the Debugger, right-click the value and select Edit. The code opens in a script editor.
|
注意:If there is an error in the script, an abbreviated error message is displayed at the top of the window. Click More to see the complete error message.
|
||
The Globals tab lists all global variables and updates their values as you step through the script. Each variable is added as it is initialized. If there are already global variables defined from running earlier scripts, they will be listed with their current values when you start the Debugger. See View Variables.
The Locals tab lists all variables by scope and updates their values as you step through the script. Select a scope in the menu. See View Variables.
If there is a particular variable or value of an expression whose values you want to watch as you step through the code, you can add them here. This is particularly useful if your script uses many variables that might be hard to watch in the Globals or Locals lists. See Work with Watches.
As namespaces are defined, they are added to the menu. Select a namespace to view any variables and their values used within the namespace. See View Variables.
Add, edit, delete, and disable or enable breakpoints on lines. See Work with Breakpoints. You can also double-click a row on the Breakpoints tab to move the cursor to the specified line.


