Domain Viewer
This report is not included in this version of JMP Clinical. If you would like to see it return in future releases, please contact JMP Technical Support.
This report aids in the review of study domains for a selected set of subjects meeting specified population, WHERE statement, and Data Filter criteria. It merges the relevant data sets based on their review flag values.
Report Results Description
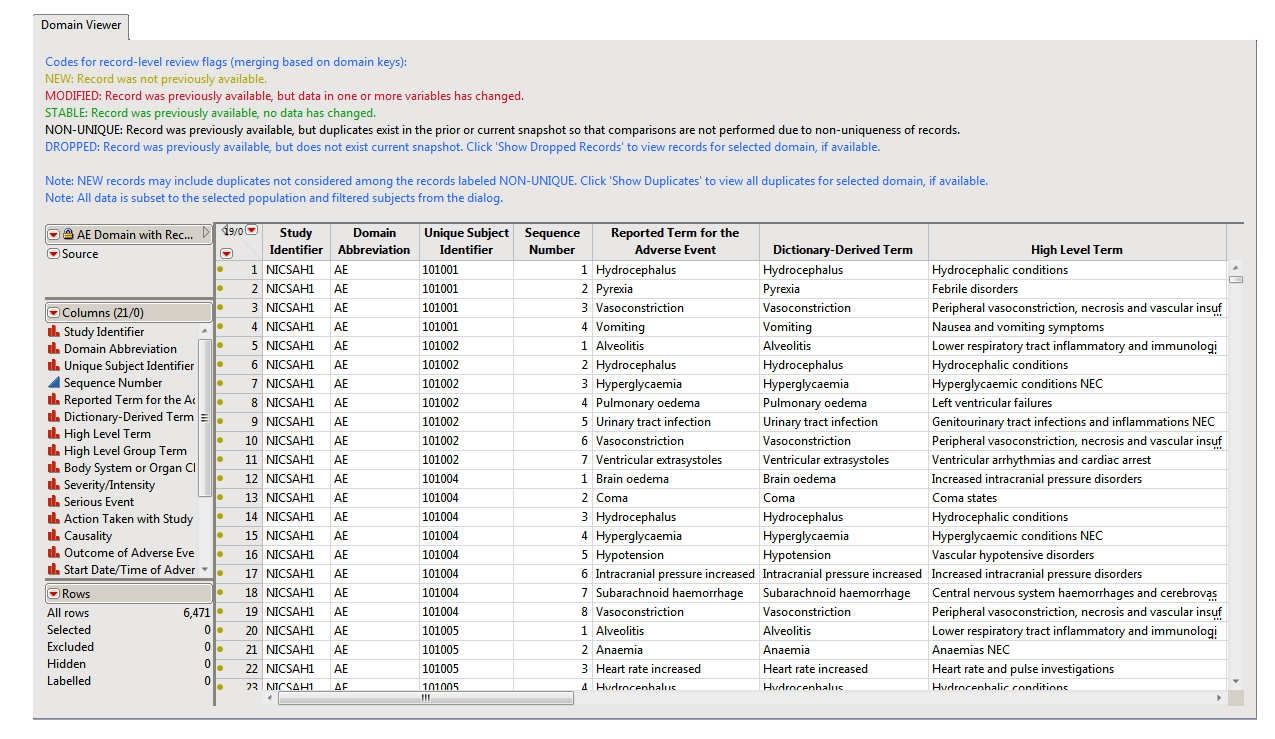
Running this report with the Nicardipine sample setting and default options generates the output shown below.

The Results contains the following elements:
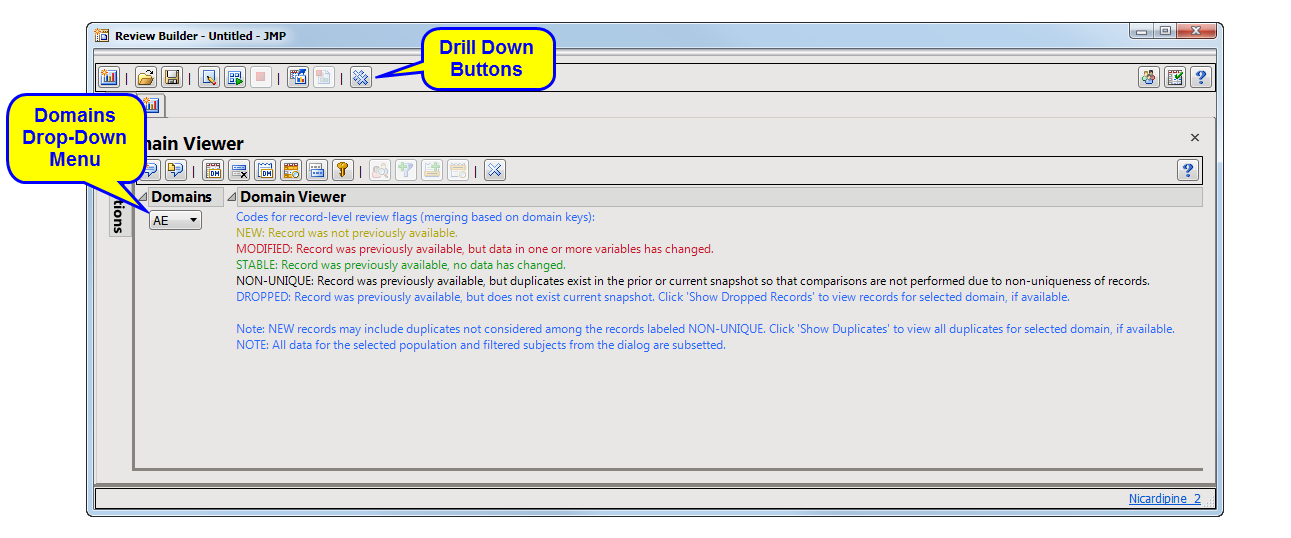
Domains
This list contains special, findings, events, and interventions domains, including split domains, that are available for the current study. Many drill-down actions are applied to the currently selected domain.

Domain Viewer
This section summarizes the definitions associated with records involved with the comparisons between snapshots for the specified domain. If this is the first time the study has been added, all records are shown as New.

It contains the following elements:
| • | One Legend. |
The legend associates color coding with record status. In the example shown above, new, modified, stable, non-unique, and dropped records are indicated with yellow, red, green, black, and blue coloring, respectively.
| • | One Table |
The domain data table is shown embedded in the dashboard.
Action Buttons
Action buttons, provide you with an easy way to drill down into your data. The following action buttons are generated by this report and are based on the currently selected Domain:
| • | Add Notes: Click  to take notes, and store them in a central location. to take notes, and store them in a central location. |
| • | View Notes: Click  to read user-generated notes. to read user-generated notes. |
| • | View Domain: Click  to open a data table for the currently selected Domain and generate colored row markers based on the legend provided on the Domain Viewer tab. The symbol varies depending on whether the record (row) has a note associated with it (asterisk) or not (filled circle). to open a data table for the currently selected Domain and generate colored row markers based on the legend provided on the Domain Viewer tab. The symbol varies depending on whether the record (row) has a note associated with it (asterisk) or not (filled circle). |
| • | Remove Stable Records: Click  to remove any records that have remained static from before the current update. to remove any records that have remained static from before the current update. |
| • | View Domain Notes: Click  to open a data table of all available notes for the currently selected Domain. This includes JMP Clinical generated notes and any record-level notes created by the user using . to open a data table of all available notes for the currently selected Domain. This includes JMP Clinical generated notes and any record-level notes created by the user using . |
| • | Show Dropped Records: Click  to open a data table of any records for the currently selected Domain that were available in the previous snapshot but are not available in the current snapshot. to open a data table of any records for the currently selected Domain that were available in the previous snapshot but are not available in the current snapshot. |
| • | Show Duplicates: Click  to open a data table of any records for the currently selected Domain that are considered duplicates of one another. Duplicate records have the same values for the domain keys. The keys are available from the button. Records that have a black row marker are duplicates that occur in both the previous and current snapshot. JMP Clinical does not have the ability to compare these records between snapshots. Duplicates can also include New records that do not occur in the previous snapshot. to open a data table of any records for the currently selected Domain that are considered duplicates of one another. Duplicate records have the same values for the domain keys. The keys are available from the button. Records that have a black row marker are duplicates that occur in both the previous and current snapshot. JMP Clinical does not have the ability to compare these records between snapshots. Duplicates can also include New records that do not occur in the previous snapshot. |
| • | Show Domain Keys: Click  to display the keys for the currently selected Domain. The keys are a set of variables that when taken together, uniquely identify each row of the selected domain. The keys should include variables that are not likely to change values from one snapshot to another. to display the keys for the currently selected Domain. The keys are a set of variables that when taken together, uniquely identify each row of the selected domain. The keys should include variables that are not likely to change values from one snapshot to another. |
The following action buttons are generated by this report and are based on the currently selected record(s) (row(s)):
| • | Patient Profiles: Select subjects and click  to generate the patient profiles. See Patient Profiles for additional information. to generate the patient profiles. See Patient Profiles for additional information. |
| • | Create Subject Filter: Select subjects and click  to create a data set of USUBJIDs, which subsets all subsequently run reports to those selected subjects. to create a data set of USUBJIDs, which subsets all subsequently run reports to those selected subjects. |
| • | Add Record-Level Notes: Select records and click  to add record-level notes to the selected records. to add record-level notes to the selected records. |
| • | View Record-Level Notes: Select records and click  to view record-level notes from the selected records. to view record-level notes from the selected records. |
Tip: All record-level notes (user and JMP Clinical defined) for the selected Domain are visible using . All subject- and record-level notes (user and JMP Clinical defined) for the subjects of the selected records (rows) are visible using .
The output of this report includes data tables with records color-coded by record-level review flags.
Report Options

Filtering the Data:
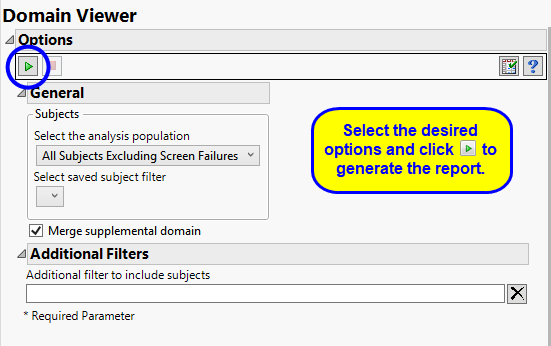
Filters enable you to restrict the analysis to a specific subset of subjects. You can also filter based on population flags (Safety is selected by default) within the study data.
If there is a supplemental domain (SUPPXX) associated with your study, you can opt to merge the non-standard data contained therein into your data.
See Select the analysis population, Select saved subject filter, Merge supplemental domain, and Additional Filter to Include Subjects for more information.
Note: Subjects not meeting filtering criteria remain in the domains but are not surfaced in the viewer.