Manhattan Plot
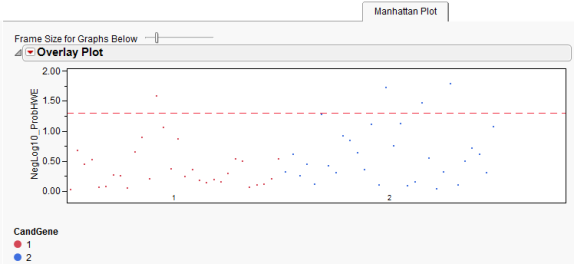
A Manhattan plot is a type of scatter plot, commonly used to display dense data, or data of highly diverse orders of magnitude. This plot was named after its similarity in shape to the Manhattan skyline: a silhouette of tall skyscrapers towering above the shorter, but variable-height, buildings.
One typical use is in genomics applications, such as Genome-Wide Association Studies (GWAS), where there are multiple annotation groups. In GWAS Manhattan plots, genomic coordinates or annotation groups are displayed along the x-axis, with the negative logarithm of the association p-value for each single nucleotide polymorphism (SNP) displayed on the y-axis. A horizontal reference line is drawn as a red, dashed line at the significance level that was specified. For -log- or -log10-converted p-values, markers above this line are significant; for p-values on the original scale, markers below the line are significant. Because the strongest associations have the smallest p-values (for example, 10-15), their negative logarithms are the greatest (for example, 15).

Note:A separate plot is created for each association test performed, and if any BY variables were selected, a separate chart is displayed for each BY group as well.