Standardized Residual Plots
Residual plots are widely seen in regression analyses. Examination of residual plot pattern can be useful in determining whether there are additional variables that should be included in the regression model. Residual plots also assist in outlier detection. More commonly, residual plots are used as diagnostic tools in deciding whether a distribution or model fit the data well. In linear regression, residuals are assumed to be normally distributed. Therefore, for convenience, they are transformed to the standardized form in standardized residual plots.
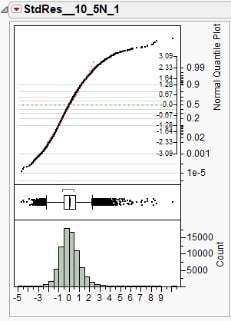
In the example below, the standardized residual quantile plot is shown in parallel with a histogram of counts. The median value of x corresponds to minimal fitting error in the normal quantile plot.

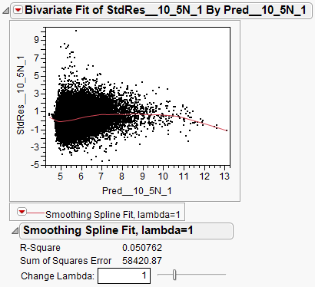
A plot of bivariate fit of the standardized residuals over a prediction interval is shown below. This plot reveals a greater fitting error at x=5 compared to x=8.
