Fitness Information Plot
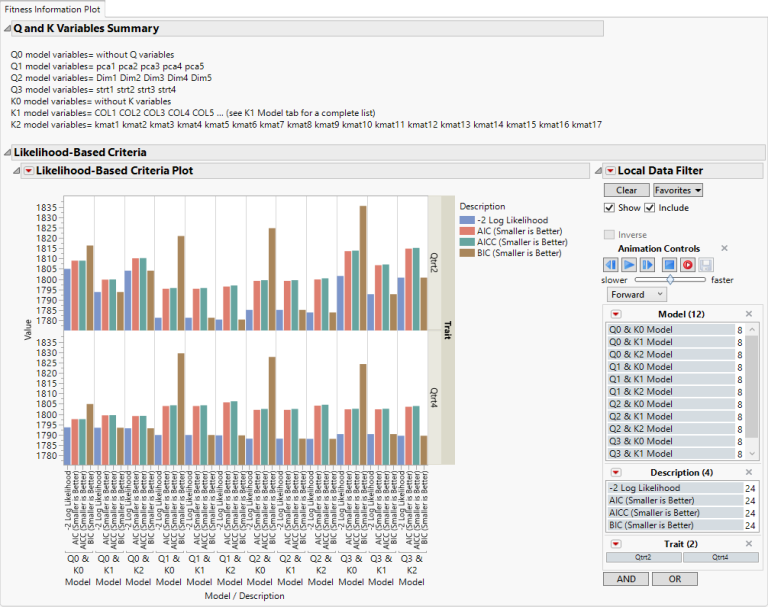
The Fitness Information Plot tab is shown below:

The Distributions tab contains the following elements:
| • | A Q and K Variables summary |
This summary shows a list of the Q and K variables that are present in each combination of Q and K matrices.
| • | A Model Fitting Information plot |
This plot shows the values of model information criteria on the y-axis for each model combination of Q and K matrices shown in the x-axis. Model information criteria are relative measures of model fitness, and models with smaller values of information criteria are preferable.
To identify the best fitting model to the current data among all evaluated models, one can choose a model information criterion and compare its value across all models, the best model is the one with the smallest value.