Results (Compare QTL Plots)

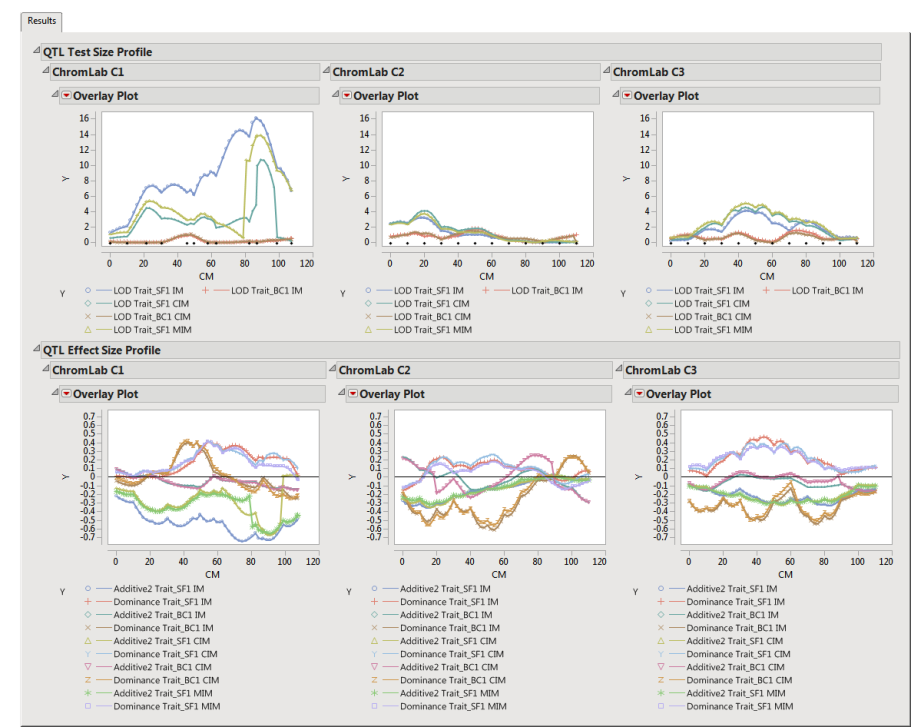
The Results tab contains the following elements:
| • | QTL Test Size Profile. |
These plots display the QTL Test Size versus the QTL testing location for each chromosome. Black diamonds near the x-axis indicate the position of markers, and these are displayed when the option to Display QTL location has been checked.
| • | QTL Effect Size Profile. |
These plots display the QTL Effect Size versus the QTL testing location for each chromosome. These plots are shown only when some QTL Effect Size variables are specified