Results (SNP-SNP Interactions)
The Results tab contains the following elements:

| • | One or more P-Value Distributions. |
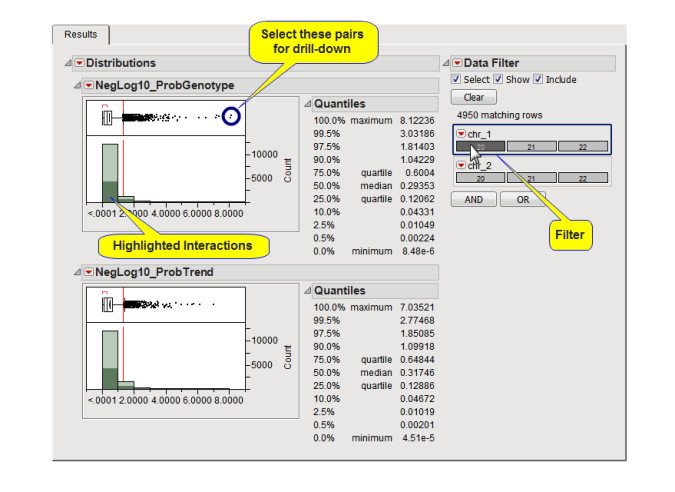
This tab displays a distributions, along with the quantiles, of the p-values for each interaction pair tested, on the -log or -log10 scale if a Conversion for p-Values was selected. A separate distribution is generated for each association test performed.
A vertical red reference line is drawn at the significance cutoff. For the -log or -log10 scale, points to the right of the reference line are significant, for non-converted p-values, points to the left are significant.
Use the Data Filter to the right when one or more Interaction Block Variables have been used to subset the pairs that are displayed in the distribution(s). For example, click  for chr_1 (circled below) to highlight those pairs with the first SNP on chromosome 20, as shown below:

You can drill-down to see more information about a pair of SNPs, a pair with a highly significant interaction p-value. For example, select one or more pairs (circled in the figure above) and click  . An example of the plots created by this is shown below. The value of the Trait Variable is displayed on the y-axis with genotypes at the two SNPs on the x-axis so you can view how distributions are different among the different genotypes. Annotation information is also displayed above the plot along with the p-values from the test(s) and, if an annotation accession variable was selected, buttons to view web pages for the SNP pair.

Note: When the trait is non-continuous, frequency charts of trait value by two- locus genotype are displayed instead.