Scree Plot
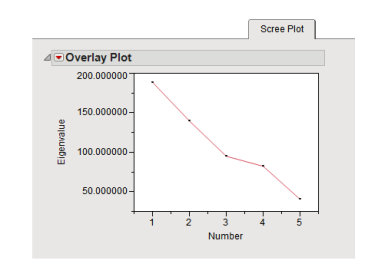
The Scree Plot tab displays a plot of the eigenvalue for the ith component versus i to show the proportion of variation explained by the principal components. This tab is generated when the Display principal components plots check box has been checked

A scree plot can be useful in determining how many principal components to include in the model testing for association. Often the component where the plot begins to flatten out is the best choice for the number of components to use. This process can be run first without any Trait Variables specified and a large number for the Maximum Number of Principal Components specified. The Scree Plot can then be used to determine how many PCs to use for the association testing. The process can then be re-run with the PCA data set filled in and the Maximum Number of Principal Components set to the number chosen from the scree plot.