Stability
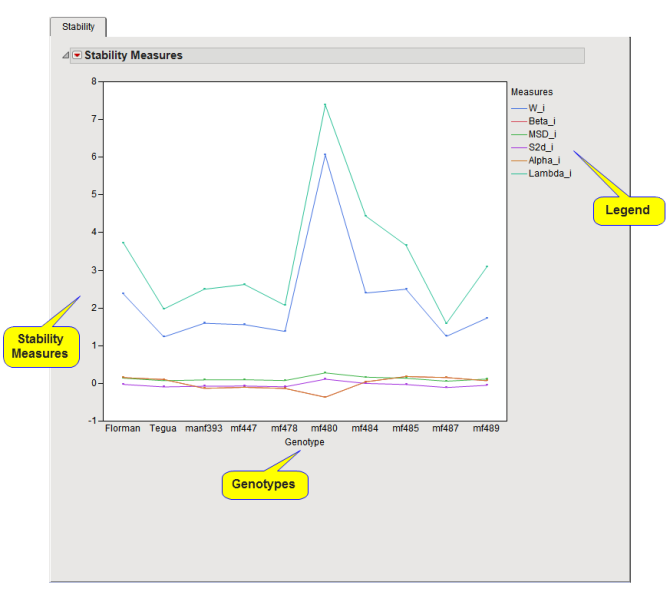
The Stability tab is shown below:

The Stability tab contains the following elements:
One Overlay Plot plot.
This plot displays various stability measures for each genotype, with the value of the stability measure represented on the y-axis. The six measures that are displayed are described in the following table:
:
|
Stability Measure |
Definition |
|
W_i |
Wricke’s ecovalence is determined using the formula:
The closer this value is to 0, the more stable the effect. This measure is highly correlated with MSD_i. |
|
Beta_i1 |
Regression Coefficient. The closer this value is to 1, the more stable the effect. |
|
MSD_i |
Pooled Deviation of E and GxE nonlinear components, broken out by genotype. Differs from S2d_i by a constant. |
|
S2d_i |
Mean Square Deviation from Regression. The closer this value is to 0, the more stable the effect. |
|
Alpha_i2 |
Linear response of trait to environmental effects. |
|
Lambda_i |
Deviation from the linear response in terms of error variance. |
