Subtree Assessment

The Subtree Assessment tab contains the following elements:
| • | Overlay Plot |
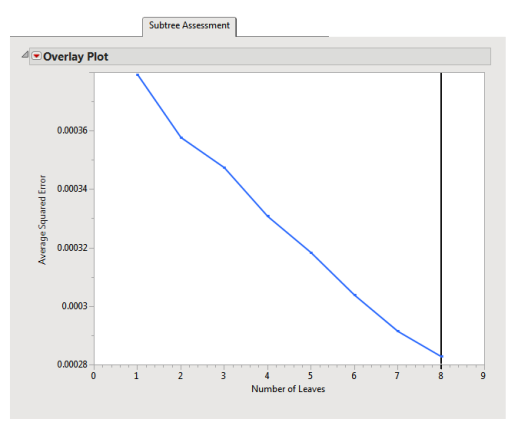
This plots the misclassification rate on the y-axis versus the number of leaves on the x-axis. A vertical reference line is drawn at the actual fitted number of leaves. This plot can be helpful in determining whether the tree is either under- or over-fitting the data.
See Overlay Plot for more information.