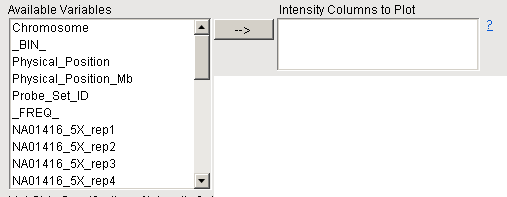
Intensity Columns to Plot
Use this field to specify the columns (samples) in the data set that represent intensity measurements whose values should be plotted.
Only the variables that you specify here are plotted in the order in which you select them.
If you leave this field and the List-Style Specification of Intensity Columns to Plot field blank, then all variables from the Experimental Design SAS Data Set are used. If there is no EDDS, all numeric variables in the Input SAS Data Set are used.
To Specify the Intensity Columns to Plot:
| 8 | Specify an Input SAS Data Set. |
All of the variables in the input data set are displayed in the Available Variables field.

| 8 | Examine the list of available variables. |
| 8 | Highlight one or more variables. |
| 8 | Click  to add the highlighted variable(s) to the Intensity Columns to Plot field, as shown below: to add the highlighted variable(s) to the Intensity Columns to Plot field, as shown below: |
